(Type integers or decimals. Do not round) (b) Verify that the requirements to perform the test using the t-distribution are satisfied Select all that apply. A The sample data come from a population that is approximately normal. B. A boxplot of the sample data shows no outliers. The students' test scores were independent of one another. D. The students were randomly sampled The sample size is larger than 30 F. None of the requirements are satisfied. (c) Use the P-value approach at the a=0.10 level of significance to test the hypotheses in part (a). Identify the test statistic to 2.26 (Round to two decimal places as needed) Approximate the P-value. The P-value is in the range 4 Check answer
(Type integers or decimals. Do not round) (b) Verify that the requirements to perform the test using the t-distribution are satisfied Select all that apply. A The sample data come from a population that is approximately normal. B. A boxplot of the sample data shows no outliers. The students' test scores were independent of one another. D. The students were randomly sampled The sample size is larger than 30 F. None of the requirements are satisfied. (c) Use the P-value approach at the a=0.10 level of significance to test the hypotheses in part (a). Identify the test statistic to 2.26 (Round to two decimal places as needed) Approximate the P-value. The P-value is in the range 4 Check answer

MATLAB: An Introduction with Applications
6th Edition
ISBN:9781119256830
Author:Amos Gilat
Publisher:Amos Gilat
Chapter1: Starting With Matlab
Section: Chapter Questions
Problem 1P

Related questions
Question
P-Value is in the
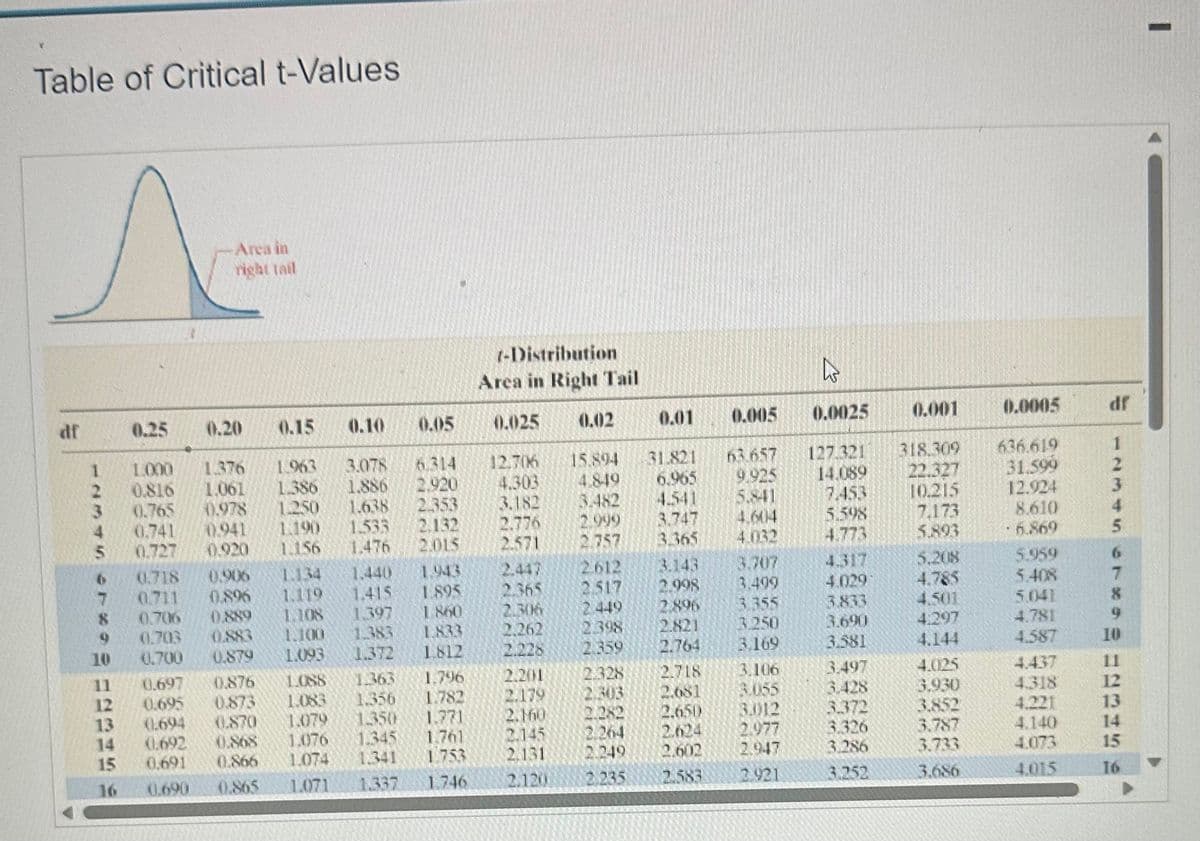
Transcribed Image Text:Table of Critical t-Values
df
1234 I
5
8
10
11
12
13
14
15
0.25
Area in
right tail
0.718
0.711
0.706
0.703
0.700
0.20
1.000 1.376
1.061
0.816
0.765 0.978
0.741
0.941
0.727
0.920
0.906
0.896
0.889
0.883
0.879
0.15
0.10
1.963
3.078
1.386 1.886
1.250
1.190
1.156
0.697 0.876
0.695
0.873
1.083
(.694
0.870
1.079
0.692
0.868 1.076
0.691
0.866
1.074
0.690
0.865
1.071
0.05
-Distribution
Area in Right Tail
0.025
1.638 2.353
1.533
2.132
2.015
1.476
1.134 1.440
1.943
1.119
1.415
1895
1.108
1860
1.397
1.100
1.383
1.833
1093
1.372 1.812
1.345
1.341
1.337
12.706
6.314
2.920
1088 1.363
1.796
1.356
1.782
1.771
1.350
1.761
1.753
1.746
4.303
3.182
2.776
2.571
2.365
2.306
2.262
2.228
2201
2.179
2.160
2.145
2.131
2.120
0.02
2612
15.894
31.821
6.965
4.849
4.541
3.482
2.999
2.757
LIST
2 449
2.398
2.359
0.01
12.328
2.303
0282
0.005
3.143
2.998
2.896
2.821
2.764
63.657
9.925
5.841
4.604
3.747
3.365
4.032
3.707
3409
3.355
3.250
3.169
2.718
3.106
2.681
3.055
2.650 3.012
2.264
2.624
2.249
2.602
2.583
2.335
2.977
2.947
2.921
27
0.0025
127.321
14.089
7.453
5.598
4.773
4317
4.029
3.833
3.690
3.581
3.497
3.428
3.372
3.326
3.286
3.252
0.001
318.309
22.327
10.215
7.173
5.893
5.208
4.785
4.501
4.297
4.144
4.025
3.930
3.852
3.787
3.733
3.686
0.0005
636.619
31.599
12.924
8.610
6.869
5.959
5.408
5.041
4.781
4.587
4.437
4.318
4.221
4.140
4.073
4.015
JP
12345 crxag
7
10
11
12
13
15
16
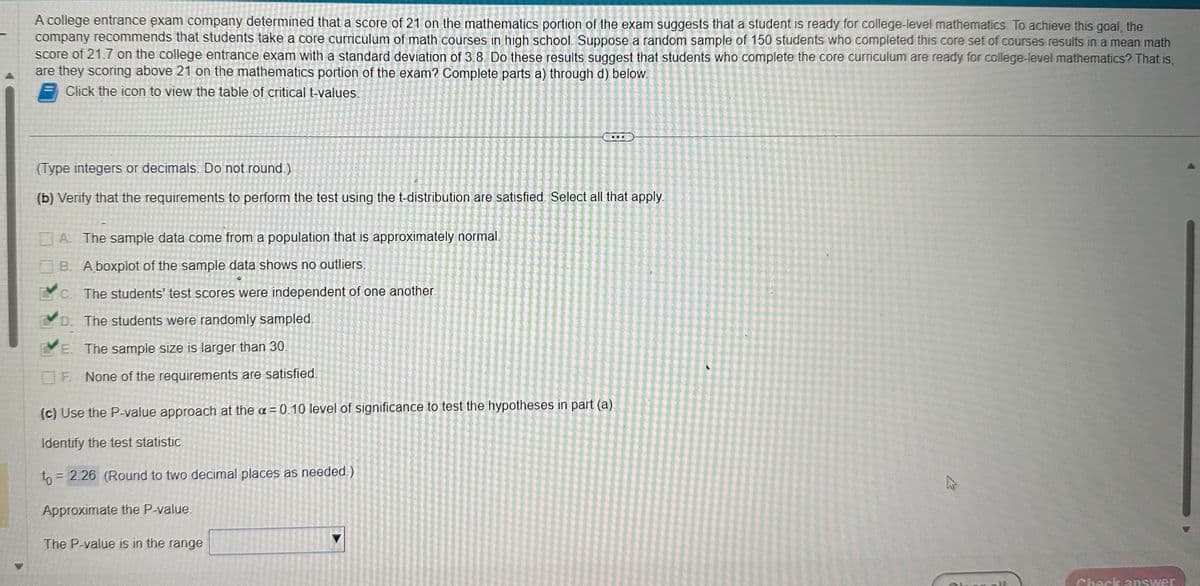
Transcribed Image Text:A college entrance exam company determined that a score of 21 on the mathematics portion of the exam suggests that a student is ready for college-level mathematics. To achieve this goal, the
company recommends that students take a core curriculum of math courses in high school. Suppose a random sample of 150 students who completed this core set of courses results in a mean math
score of 21.7 on the college entrance exam with a standard deviation of 3.8. Do these results suggest that students who complete the core curriculum are ready for college-level mathematics? That is,
are they scoring above 21 on the mathematics portion of the exam? Complete parts a) through d) below.
Click the icon to view the table of critical t-values.
(Type integers or decimals. Do not round.)
(b) Verify that the requirements to perform the test using the t-distribution are satisfied. Select all that apply.
A. The sample data come from a population that is approximately normal.
B. A boxplot of the sample data shows no outliers.
c. The students' test scores were independent of one another.
D. The students were randomly sampled.
E. The sample size is larger than 30.
F. None of the requirements are satisfied.
(c) Use the P-value approach at the x = 0.10 level of significance to test the hypotheses in part (a).
Identify the test statistic.
to = 2.26 (Round to two decimal places as needed.)
Approximate the P-value.
The P-value is in the range
27
Check answer
Expert Solution
This question has been solved!
Explore an expertly crafted, step-by-step solution for a thorough understanding of key concepts.

Step by step
Solved in 3 steps

Recommended textbooks for you
MATLAB: An Introduction with Applications
Statistics
ISBN:
9781119256830
Author:
Amos Gilat
Publisher:
John Wiley & Sons Inc

Probability and Statistics for Engineering and th…
Statistics
ISBN:
9781305251809
Author:
Jay L. Devore
Publisher:
Cengage Learning

Statistics for The Behavioral Sciences (MindTap C…
Statistics
ISBN:
9781305504912
Author:
Frederick J Gravetter, Larry B. Wallnau
Publisher:
Cengage Learning
MATLAB: An Introduction with Applications
Statistics
ISBN:
9781119256830
Author:
Amos Gilat
Publisher:
John Wiley & Sons Inc
Probability and Statistics for Engineering and th…
Statistics
ISBN:
9781305251809
Author:
Jay L. Devore
Publisher:
Cengage Learning
Statistics for The Behavioral Sciences (MindTap C…
Statistics
ISBN:
9781305504912
Author:
Frederick J Gravetter, Larry B. Wallnau
Publisher:
Cengage Learning

Elementary Statistics: Picturing the World (7th E…
Statistics
ISBN:
9780134683416
Author:
Ron Larson, Betsy Farber
Publisher:
PEARSON

The Basic Practice of Statistics
Statistics
ISBN:
9781319042578
Author:
David S. Moore, William I. Notz, Michael A. Fligner
Publisher:
W. H. Freeman

Introduction to the Practice of Statistics
Statistics
ISBN:
9781319013387
Author:
David S. Moore, George P. McCabe, Bruce A. Craig
Publisher:
W. H. Freeman