u were testing how the presence/absence of soil bacteria affected plant growth. In this you had two treatments - one with soil bacteria present, the other with soil bacteria absent. To how soil bacteria affected plant growth, you then measured plant height after 1 month. You find grow taller in the treatment with soil bacteria compared to the treatment with no soil bacteria. oh or graphs would be most appropriate for portraying the results from your experiment? SELECT APPLY. plot rt ph -t aph
u were testing how the presence/absence of soil bacteria affected plant growth. In this you had two treatments - one with soil bacteria present, the other with soil bacteria absent. To how soil bacteria affected plant growth, you then measured plant height after 1 month. You find grow taller in the treatment with soil bacteria compared to the treatment with no soil bacteria. oh or graphs would be most appropriate for portraying the results from your experiment? SELECT APPLY. plot rt ph -t aph

Human Anatomy & Physiology (11th Edition)
11th Edition
ISBN:9780134580999
Author:Elaine N. Marieb, Katja N. Hoehn
Publisher:Elaine N. Marieb, Katja N. Hoehn
Chapter1: The Human Body: An Orientation
Section: Chapter Questions
Problem 1RQ: The correct sequence of levels forming the structural hierarchy is A. (a) organ, organ system,...

Related questions

Question
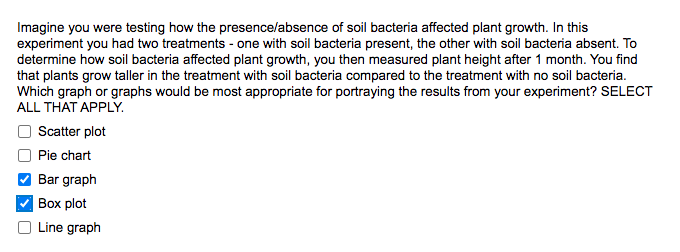
Transcribed Image Text:Imagine you were testing how the presence/absence of soil bacteria affected plant growth. In this
experiment you had two treatments - one with soil bacteria present, the other with soil bacteria absent. To
determine how soil bacteria affected plant growth, you then measured plant height after 1 month. You find
that plants grow taller in the treatment with soil bacteria compared to the treatment with no soil bacteria.
Which graph or graphs would be most appropriate for portraying the results from your experiment? SELECT
ALL THAT APPLY.
Scatter plot
Pie chart
Bar graph
Box plot
Line graph
Expert Solution
This question has been solved!
Explore an expertly crafted, step-by-step solution for a thorough understanding of key concepts.

This is a popular solution!

Trending now
This is a popular solution!

Step by step
Solved in 2 steps

Knowledge Booster


Learn more about
Need a deep-dive on the concept behind this application? Look no further. Learn more about this topic, biology and related others by exploring similar questions and additional content below.Recommended textbooks for you
Human Anatomy & Physiology (11th Edition)
Biology
ISBN:
9780134580999
Author:
Elaine N. Marieb, Katja N. Hoehn
Publisher:
PEARSON

Biology 2e
Biology
ISBN:
9781947172517
Author:
Matthew Douglas, Jung Choi, Mary Ann Clark
Publisher:
OpenStax

Anatomy & Physiology
Biology
ISBN:
9781259398629
Author:
McKinley, Michael P., O'loughlin, Valerie Dean, Bidle, Theresa Stouter
Publisher:
Mcgraw Hill Education,
Human Anatomy & Physiology (11th Edition)
Biology
ISBN:
9780134580999
Author:
Elaine N. Marieb, Katja N. Hoehn
Publisher:
PEARSON
Biology 2e
Biology
ISBN:
9781947172517
Author:
Matthew Douglas, Jung Choi, Mary Ann Clark
Publisher:
OpenStax
Anatomy & Physiology
Biology
ISBN:
9781259398629
Author:
McKinley, Michael P., O'loughlin, Valerie Dean, Bidle, Theresa Stouter
Publisher:
Mcgraw Hill Education,

Molecular Biology of the Cell (Sixth Edition)
Biology
ISBN:
9780815344322
Author:
Bruce Alberts, Alexander D. Johnson, Julian Lewis, David Morgan, Martin Raff, Keith Roberts, Peter Walter
Publisher:
W. W. Norton & Company

Laboratory Manual For Human Anatomy & Physiology
Biology
ISBN:
9781260159363
Author:
Martin, Terry R., Prentice-craver, Cynthia
Publisher:
McGraw-Hill Publishing Co.

Inquiry Into Life (16th Edition)
Biology
ISBN:
9781260231700
Author:
Sylvia S. Mader, Michael Windelspecht
Publisher:
McGraw Hill Education