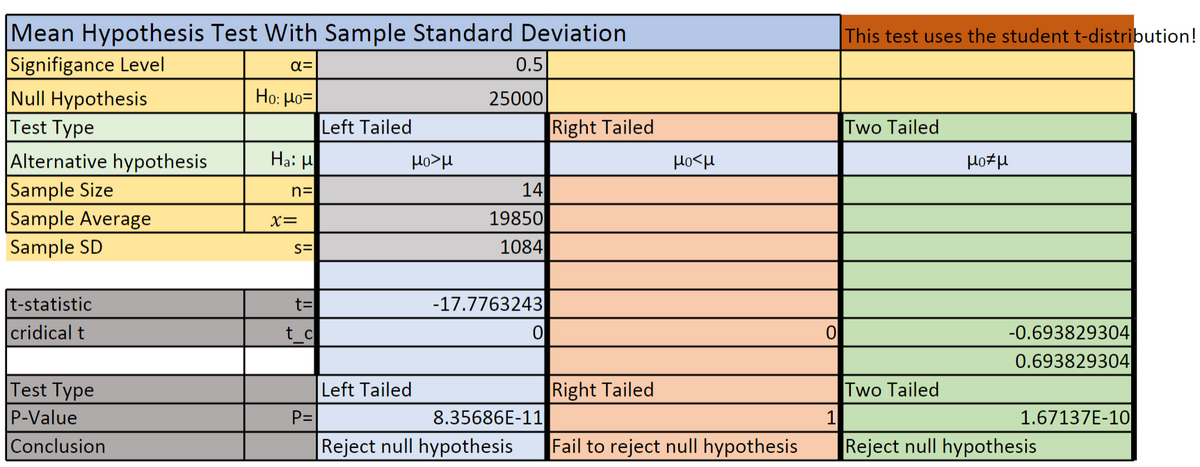
Range anxiety is one of the reasons consumers are reluctant to switch to an electric vehicle, and battery degradation adds to this anxiety. That is, the battery's charge capacity decreases with an increase in charge cycles. Tesla claims that its batteries typically suffer a 10% degradation after 100,000 miles of use. Attached to the link below is the sample data of 61 different car capacities after reaching 100,000 miles of use. Use the data to test the claim with an of 1%. Conclude your analysis to telling us what the test says about the claim. Hypothesis testing is an enormously practical way of objectively testing a claim with evidence from the real world if you follow good data sampling and collecting practices. In this exercise, you will only practice the first step in the process. That is, choose or state a claim that you would be interested in testing to see if it is true. Each member should choose a claim they would like to test, and decide if it can be phrased as a mean or proportion test. Battery Capacity after 100,000 miles of use 89 90 91.5 92 92.5 95 95.5 96 93 93.5 94 94 91 93.5 93.5 94 91.5 92.5 93 89.5 91.5 92.5 92.5 90.5 92 93 95 95 96 96 95 93.5 93 93.5 93 93 93 93 96.5 90.5 90 87.5 90 91 91 91 91.5 92 92 92 92 92.5 93 93 93 85 84.5 84 86 87 88


Hypothesis testing is an enormously practical way of objectively testing a claim with evidence from the real world if you follow good data sampling and collecting practices. In this exercise, you will only practice the first step in the process. That is, choose or state a claim that you would be interested in testing to see if it is true. Each member should choose a claim they would like to test, and decide if it can be phrased as a mean or proportion test.
Battery Capacity after
100,000 miles of use
89
90
91.5
92
92.5
95
95.5
96
93
93.5
94
94
91
93.5
93.5
94
91.5
92.5
93
89.5
91.5
92.5
92.5
90.5
92
93
95
95
96
96
95
93.5
93
93.5
93
93
93
93
96.5
90.5
90
87.5
90
91
91
91
91.5
92
92
92
92
92.5
93
93
93
85
84.5
84
86
87
88
Given information:
| x |
| 89 |
| 90 |
| 91.5 |
| 92 |
| 92.5 |
| 95 |
| 95.5 |
| 96 |
| 93 |
| 93.5 |
| 94 |
| 94 |
| 91 |
| 93.5 |
| 93.5 |
| 94 |
| 91.5 |
| 92.5 |
| 93 |
| 89.5 |
| 91.5 |
| 92.5 |
| 92.5 |
| 90.5 |
| 92 |
| 93 |
| 95 |
| 95 |
| 96 |
| 96 |
| 95 |
| 93.5 |
| 93 |
| 93.5 |
| 93 |
| 93 |
| 93 |
| 93 |
| 96.5 |
| 90.5 |
| 90 |
| 87.5 |
| 90 |
| 91 |
| 91 |
| 91 |
| 91.5 |
| 92 |
| 92 |
| 92 |
| 92 |
| 92.5 |
| 93 |
| 93 |
| 93 |
| 85 |
| 84.5 |
| 84 |
| 86 |
| 87 |
| 88 |

Trending now
This is a popular solution!

Step by step
Solved in 3 steps


