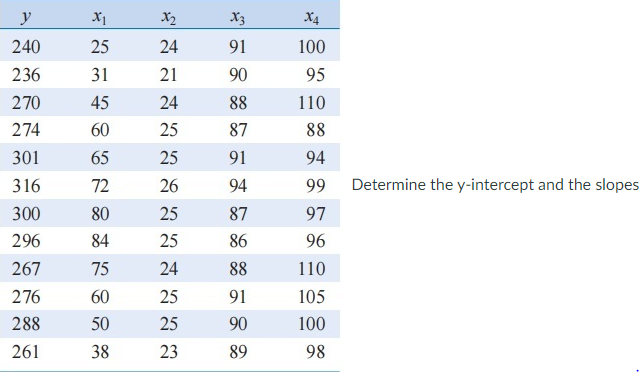
y X2 X3 X4 240 25 24 91 100 236 31 21 90 95 270 45 24 88 110 274 60 25 87 88 301 65 25 91 94 316 72 26 94 99 Determine the y-intercept and the slopes 300 80 25 87 97 296 84 25 86 96 267 75 24 88 110 276 60 25 91 105 288 50 25 90 100 261 38 23 89 98


Q: Adviser to 42 Member local charter of the national mathematics honor society At the end of the s...
A: Given,Total no.of members=25
Q: Find the corresponding area between z=0 and each of the following z-values: 1. z =1.75 2. z =-2.58 3...
A:
Q: The following data show the monthly production output report for employees at a small manufacturing ...
A:
Q: An oil company estimates that only 1 well in 17 will yield commercial quantities of oil. Assume that...
A:
Q: Students estimated the length of one minute without reference to a watch or clock, and the times (se...
A: The parametric test are used to estimate the hypothetical relationship exist between sample and the ...
Q: . What is the probability that in the time interval [0,200 hours] colour "red" is visible if it is k...
A: here given, In a set of traffic lights, the colour "red"(as well as green and yellow) is indicated b...
Q: Tex Tob Ltd is considering introducing new cleaning chemical for Timber floors. At present they are ...
A: One way ANOVA : The one-way analysis of variance (ANOVA) is performed to see if there are any statis...
Q: random sample of size 2 from a population with a finite (2r)th moment, 5. For a) Find Mr b) Find E M...
A: @solution::::
Q: Investor in Australian Stock Exchange (ASX) tells, he predicts that there is a 60% probability that ...
A:
Q: Assume that a procedure yields a binomial distribution with a trial repeated n=5n=5 times. Use some ...
A:
Q: Describe the sampling distribution of means. What is it used for?
A: The distribution of sample means is defined as the set of means from all the possible random samples...
Q: Using your calculator, find the range and standard deviation, round to two decimals places: The tab...
A: Given information- We have given the table below gives the number of hours spent watching TV last we...
Q: In a business, the Chief Executive Officer wants to know if his workers are for or against mandatory...
A: Given: Managers Team leaders Employees Total Approve 17 22 15 54 Against 34 25 14 73 N...
Q: 2 Example 10-6. X and Y are two random variables with variances o²x and oy respectively and r is the...
A: It is given that X and Y are two random variables with variance σ2x and σ2Y and r is correlation coe...
Q: Area I Area lI Age Group (in years) Population |No. of Deaths No. of Deaths Population 0-10 3000 55 ...
A: Given: Age Group Area I Area II Population No of ...
Q: Which of the following is not a property of the mean? A Easily affected by extreme values. B Can be ...
A:
Q: In a clinical trial of a drug intended to help people stop smoking, 126 subjects were treated with t...
A: The power of test is defined as rejecting the null hypothesis when the alternative is true. It os gi...
Q: Create four variables that have to do with the concept of "breakfast", one at each level of measurem...
A: Given task is to create variables that have to do with concept of "breakfast" one at each level of m...
Q: Determine whether the statement is true or false. If it is false, rewrite it as a true statement.
A: here , standard deviation of distribution of sample mean =σn
Q: Transistor gain is an integrated circuit device between emitter and collector (hFE) is related to tw...
A: Given: Drive-in time, min (x1) Dose ions (x2) Gain or hFE (y) 195 4 1004 255 4 1636 195 ...
Q: In a random sample of 22 people, the mean commute time to work was 30.4 minutes and the standard dev...
A: Given that n =22, x bar = 30.4, s = 7.1,alpha =0.05 Construct 95% C.I Margin of error= ? Select the ...
Q: Q2. Here, the joint density function of two random variable X and Y are, S(2,9) = {clE*y* 3y² + x²y³...
A:
Q: National College Health Assessment Survey The following exercise uses data on college students colle...
A:
Q: Find the area of the shaded region under the standard normal distribution to the right of the given ...
A:
Q: se R’s “pbinom()” function to verify Chebyshev’s inequality for k=2 and k=3 when X follows Binomial...
A: Given that, X follows Binomial distribution with parameters n=30 and p=0.2. Mean of Binomial distrib...
Q: How can I solved Question d and e?
A:
Q: The table summarizes results from pedestrian deaths that were caused by automobile accidents. Pedest...
A:
Q: A certain group of test subjects had pulse rates with a mean of 74.3 74.3 beats per minute and a st...
A: It is needed to the limits using range rule of thumb.
Q: The provided Minitab output displays descriptive statistics for the amount of financial aid, in thou...
A: The descriptive statistics for the amount of financial aid is given.
Q: 4.43 Consider the probability distribution for the random vari- able x shown here: 2 .4 10 .2 1 4 P(...
A: See the handwritten solution
Q: Three red and four blue balls are put in a box. If two balls are chosen at random, find the probabil...
A: We have given that Number of red balls=R =3 Number of blue balls=B=4 Total number of cases =7 Favo...
Q: A beverage machine is adjusted to release a certain amount of syrup into a chamber where it is mixed...
A:
Q: Alex's times for running a mile are Normally distributed with a mean time of 5.28 minutes and a stan...
A:
Q: Giving a test to a group of students, the grades and gender are summarized below A B C Total Mal...
A:
Q: Obtain the area under the standard normal curve: Round to 4 decimal places A) to the right of z = 1....
A: Solution-: We find, (A) P(Z>1.43)=? (B) P(Z<-1.65)=?
Q: the number of observations and measurements taken is the sample size True or False
A: We have given that, the number of observations and measurements taken is the sample size? True or F...
Q: (a) What is the probability that a randomly chosen tire will cover a distance of 500km without a sin...
A:
Q: This dataset represents a random sample of data from a local computer shop. The analyst collected in...
A: In the given problem,
Q: The mean life of a tire is 30,000 km. The standard deviation is 2000km. About 99.7% of all tires hav...
A: Here use chebyshev rule and Impirical rule
Q: Use the spinner below. 12 1 11 10 3 4 5 7 6 P(3 or 8) = %3D %3D 00
A:
Q: The life span of a 30-watt LED light is known to be normally distributed with o = 20 hours. A random...
A: Given that Mean = 1020 , n =20 , sigma = 20 ,alpha =0.1 Find C.I lower bound C.I two sided Which sta...
Q: For the following situation, find the mean and standard deviation of the population. List all sample...
A:
Q: When taking random samples of n observations from a population that is not normally distributed, the...
A: Given that, When taking random samples of n observations from a population that is not normally dist...
Q: Department of Education was analysing the average mathematics test score in the schools in Victoria....
A: 1. Regression model: From the output, t statMath-Degree=AStandard Error 3.543263=A0.0698...
Q: In which interval are there more men: 220-240 or 280-3407 There are more men in the interval (Choose...
A:
Q: Determine the null and alternative hypotheses based on the following: Historically, the time to or...
A: Given claim: Jim, the owner, implements a new system for ordering and delivering pizzas that he bel...
Q: JOYFUL Fashion Company is reviewing the monthly sales in year 2021. each month were as below: The mo...
A: Hi! Thank you for the question, As per the honor code, we are allowed to answer three sub-parts at a...
Q: Each time a shopper purchases a tube of toothpaste, he either choose brand A or brand B. Suppose tha...
A: Since the probability of purchase of any of the brands (i.e., "A" or "B") defines the probability o...
Q: Please create different research scenarios that suitable to be analyzed using the following methods:...
A: T-Test : T-Test are used to test population mean. There are different types ...
Q: An article in Nature Genetics studied gene expression as a function of treatments for leukemia. One ...
A: In this case, the given 4 box plots for the various groups (i.e., the High dose, and control groups ...

Step by step
Solved in 2 steps with 3 images

- Sales Barnes & Noble had annual sales of $6.8 billion in 2013 and $6.1 billion in 2015. Use the Midpoint Formula to estimate the sales in 2014. Assume that the annual sales followed a linear pattern.Group I nesting boxes were well separated from each other and well hidden by available brush. There were a total of 480 eggs in group I, of which a field count showed about 275 hatched. Group II nesting boxes were placed in highly visible locations and grouped closely together. There were a total of 874 eggs in group II boxes, of which a field count showed about 272 hatched. Find a point estimate for p1, the proportion of eggs that hatch in group I nest box placements. Round your answer to three decimal places. In linear analysis, what is meant by the "best fitting" or "least squares" line? Choices: A: of all possible lines, the line with the steepest slope B. The line that minimizes the differences between the actual values of y and the predicted values of y C. of all possible lines, the line with the flattest slope D. the line that minimizes the differences between actual values of y and the mean value of y
- A study was done to look at the relationship between number of vacation days employees take each year and the number of sick days they take each year. The results of the survey are shown below. Vacation Days 2 7 0 3 2 9 15 3 8 0 11 Sick Days 10 3 6 5 4 5 0 4 2 11 0 Interpret the y-intercept in the context of the question: If an employee takes no vacation days, then that employee will take 8 sick days. The y-intercept has no practical meaning for this study. The best prediction for an employee who doesn't take any vacation days is that the employee will take 8 sick days. The average number of sick days is predicted to be 8A two-factor study investigates the effects of self-esteem (low vs. high) and gender (males vs. females) on anxiety scores. The following data represents the means for each treatment condition. Low self-esteem High self-esteem Male 5 12 Female 10 3 The data shows that there is a self-esteem by gender interaction. a. Draw a graph by hand representing the interaction. On the x-axis put self-esteem.TOPIC: MEASURE OF POSITION AND CENTRAL TENDENCY
- Bargain Rental Car offers rental cars in an off-airport location near a major tourist destination in California. Management would like to better understand the variable and fixed portions of its car washing costs. The company operates its own car wash facility in which each rental car that is returned is thoroughly cleaned before being released for rental to another customer. Management believes that the variable portion of its car washing costs relates to the number of rental returns. Accordingly, the following data have been compiled: Month Rental Returns Car Wash Costs January 2,400 $ 11,300 February 2,500 $ 13,300 March 2,800 $ 12,100 April 3,100 $ 14,700 May 3,700 $ 16,500 June 5,100 $ 23,900 July 5,600 $ 22,500 August 5,600 $ 22,900 September 4,700 $ 23,100 October 4,100 $ 22,000 November 2,200 $ 11,000 December 2,900 $ 15,300 2. Using least-squares regression, estimate the variable cost per rental return and the monthly fixed cost incurred to wash cars. (Round Fixed cost to the…We are interested in exploring the relationship between the weight of a vehicle and its fuel efficiency (gasoline mileage). The data in the table show the weights, in pounds, and fuel efficiency, measured in miles per gallon, for a sample of 12 vehicles. Weight FuelEfficiency 2715 26 2560 26 2630 29 2790 38 3000 24 3410 24 3640 20 3700 25 3880 22 3900 20 4060 20 4710 16 1) Graph a scatterplot of the data.A researcher explored the relationship between the percent of snow days during the month of January and the percent of students that receive an A on class finals at the same schools. The researcher collects information from 6 schools, shown in the table below. Use the graph below to plot the points and develop a linear relationship between the percent of January snow days and the percent of 'A' final exams. School Number % of Snow Days % of A Finals 1 5 25 2 7 45 3 10 50 4 12 65 5 20 70 6 25 86 Using the linear relationship graphed above, estimate the percent of 'A' finals if there are 2% snow days. Provide your answer below:
- Southerly Showtime Movie Theaters, Inc. owns and operates a chain of cinemas in several markets in the southern United States. The owners would like to estimate weekly gross revenue as a function of advertising expenditures. Data for a sample of eight markets for a recent week follow. (Let x1 represent Television Advertising ($100s), x2 represent Newspaper Advertising ($100s), and y represent Weekly Gross Revenue ($100s).) Market Weekly Gross Revenue ($100s) Television Advertising ($100s) Newspaper Advertising ($100s) Market 1 101.3 4.9 1.4 Market 2 51.9 2.9 3.1 Market 3 74.8 3.9 1.4 Market 4 126.2 4.4 4.2 Market 5 137.8 3.7 3.9 Market 6 101.4 3.4 2.4 Market 7 237.8 5.1 8.5 Market 8 219.6 7.0 5.7 (a) Develop an estimated linear regression equation with the amount of television advertising as the independent variable. (Round your numerical values to four decimal places.) ŷ = Test for a significant relationship between the amount spent on television…Vineyards again Instead of Age, perhaps the Size of thevineyard (in acres) is associated with the price of thewines. Look at the scatterplot: a) Do you see any evidence of an association?b) What concern do you have about this scatterplot? c) If the red “+” data point is removed, would the corre-lation become stronger or weaker? Explain. d) If the red “+” data point is removed, would the slopeof the line increase or decrease? Explain.TOPIC: MEASURES OF POSITION AND CENTRAL TENDENCY
