uppose IQ scores were obtained for 20 randomly selected sets of siblings. The 20 pairs of measurements yield x= 97.71, y = 96.65, r= 0.874, P-value = 0.000, and y = 1.21 +0.98x, here x represents the IQ score of the older child. Find the best predicted value of y given that the older child has an IQ of 110? Use a significance level of 0.05. Click the icon to view the critical values of the Pearson correlation coefficient r. Critical Values of the Pearson Correlation Coefficient r he best predicted value of y isO Round to two decimal places as needed.) Critical Values of the Pearson Correlation Coefficient r INOTE: To test Ho p= 0 jagainst H,: p#0, reject if the absolute value of r greater than the critical value in the table. - 0.01 0.990 = 0.05 0.950 0.878 0.811 0.754 0.707 0.959 0.917 0.875 0.834 0.798 0.765 0.735 0.708 0.684 0.661 0.641 0.623 0.606 0.590 0.575 0.561 0.505 0.463 0.430 0.402 0.378 0.361 0.330 0.305 0.286 0.269 0.256 0.666 0.632 10 11 12 13 14 0.602 0.576 0.553 0.532 0.514 0.497 0.482 0.468 0.456 0.444 0.396 0.361 0.335 0.312 0.294 0.279 0.254 0.236 0.220 15 16 17 18 19 20 25 30 35 40 45 50 60 70 80 90 100 0.207 0.196
uppose IQ scores were obtained for 20 randomly selected sets of siblings. The 20 pairs of measurements yield x= 97.71, y = 96.65, r= 0.874, P-value = 0.000, and y = 1.21 +0.98x, here x represents the IQ score of the older child. Find the best predicted value of y given that the older child has an IQ of 110? Use a significance level of 0.05. Click the icon to view the critical values of the Pearson correlation coefficient r. Critical Values of the Pearson Correlation Coefficient r he best predicted value of y isO Round to two decimal places as needed.) Critical Values of the Pearson Correlation Coefficient r INOTE: To test Ho p= 0 jagainst H,: p#0, reject if the absolute value of r greater than the critical value in the table. - 0.01 0.990 = 0.05 0.950 0.878 0.811 0.754 0.707 0.959 0.917 0.875 0.834 0.798 0.765 0.735 0.708 0.684 0.661 0.641 0.623 0.606 0.590 0.575 0.561 0.505 0.463 0.430 0.402 0.378 0.361 0.330 0.305 0.286 0.269 0.256 0.666 0.632 10 11 12 13 14 0.602 0.576 0.553 0.532 0.514 0.497 0.482 0.468 0.456 0.444 0.396 0.361 0.335 0.312 0.294 0.279 0.254 0.236 0.220 15 16 17 18 19 20 25 30 35 40 45 50 60 70 80 90 100 0.207 0.196

Glencoe Algebra 1, Student Edition, 9780079039897, 0079039898, 2018
18th Edition
ISBN:9780079039897
Author:Carter
Publisher:Carter
Chapter10: Statistics
Section10.4: Distributions Of Data
Problem 19PFA

Related questions
Question
100%
5- Hi Wonderful Bartleby Team (Thanks for all the help I do really aprecciate all you guys do)
(Please pay attention to the image posted.)
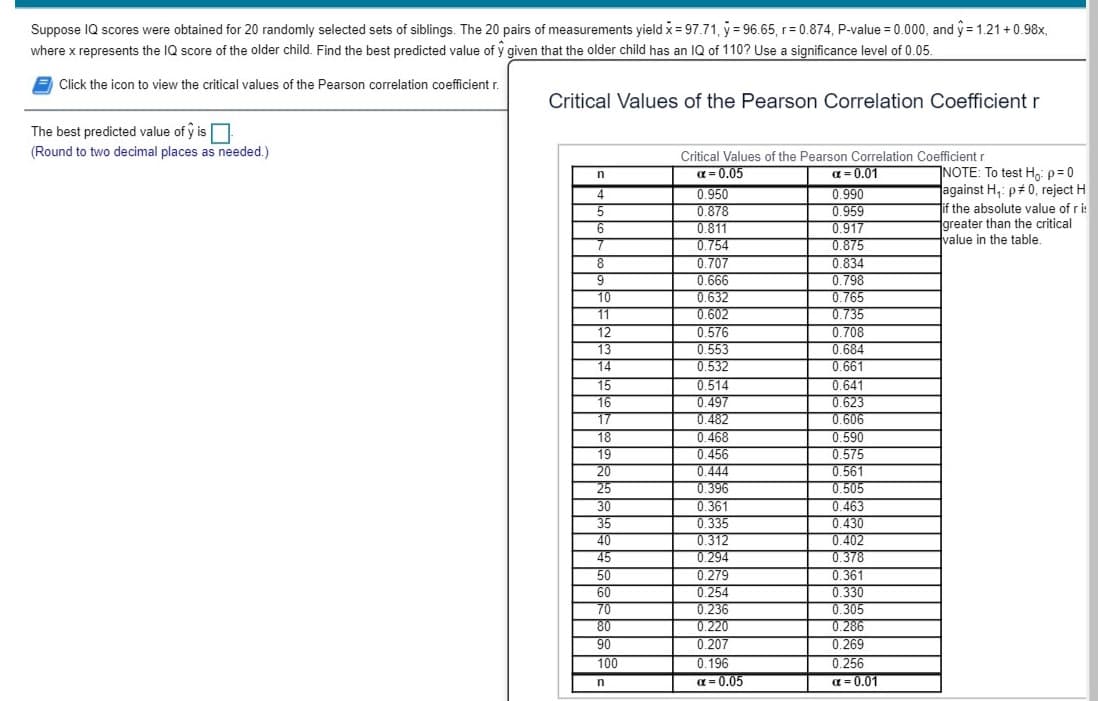
Transcribed Image Text:Suppose IQ scores were obtained for 20 randomly selected sets of siblings. The 20 pairs of measurements yield x = 97.71, y 96.65, r= 0.874, P-value = 0.000, and y = 1.21 +0.98x,
where x represents the IQ score of the older child. Find the best predicted value of y given that the older child has an IQ of 110? Use a significance level of 0.05.
E Click the icon to view the critical values of the Pearson correlation coefficient r.
Critical Values of the Pearson Correlation Coefficient r
The best predicted value of y is
(Round to two decimal places as needed.)
Critical Values of the Pearson Correlation Coefficient r
INOTE: To test Ho: p= 0
against H,: p#0, reject H
a= 0.05
a = 0.01
n
0.950
0.878
0.811
0.754
0.707
0.666
0.632
0.602
0.576
0.553
0.532
0.514
0.497
0.482
0.468
0.456
0.444
0.396
0.361
0.335
0.312
0.294
0.279
0.254
0.236
0.220
0.207
0.196
a= 0.05
0.990
0.959
0.917
0.875
0.834
0.798
0.765
0.735
0.708
0.684
0.661
4
the absolute value of r i:
greater than the critical
value in the table.
8
9
10
11
12
13
14
15
16
17
0.641
0.623
0.606
0.590
0.575
0.561
0.505
0.463
0.430
0.402
0.378
0.361
0.330
0.305
0.286
0.269
18
19
20
25
30
35
40
45
50
60
70
80
90
100
0.256
a = 0.01
n
Expert Solution
This question has been solved!
Explore an expertly crafted, step-by-step solution for a thorough understanding of key concepts.

Step by step
Solved in 2 steps with 1 images

Recommended textbooks for you
Glencoe Algebra 1, Student Edition, 9780079039897…
Algebra
ISBN:
9780079039897
Author:
Carter
Publisher:
McGraw Hill
Glencoe Algebra 1, Student Edition, 9780079039897…
Algebra
ISBN:
9780079039897
Author:
Carter
Publisher:
McGraw Hill