use at least one social media site, broken down by age, is based on data reported by Pew as of February 2019. The expected counts are given below the observed counts. The contribution to the chi-square statistic is given below the expected count. Use Social Media Age 18-29 Age 30-49 Age 50-64 Age 65+ Yes 212 160.761 16.33 324 269.07 11.21 293 288.82 0.06 156 266.35 45.72 No 24 75.24 35.89 71 125.93 23.96 131 135.18 0.13 235 124.66 97.68 Compute the chi-square statistic X² for this two- way table. Give your answer to two decimal places.
Q: 1. Make a scatter plot of the table provided in the image. B. Write a linear/exponential equation…
A: Since you have asked multiple questions, we will solve the first question for you. If you want any…
Q: Let the joint density of random variables x and y be given by the following: fx,y(x,y) = 0.158(x +…
A: As per the guidelines, solving first question when multiple questions are posted. Kindly re-post the…
Q: 5)The Internal Revenue Service reports that the mean federal income tax paid in the year was $8040.…
A:
Q: (c) Suppose n = 61 and p = 0.38. (For each answer, enter a number. Use 2 decimal places.) n-p= 23.18…
A: c) It is given that n=61 and p=0.38.
Q: For samples of the specified size from the population described, find the mean and standard…
A: The following information has been given: Let X be a random variable represents the annual snowfall.…
Q: For samples of the specified size from the population described, find the mean and standard…
A: From the provided information, Mean (µ) = 83 Standard deviation (σ) = 14 X~N (83, 14)
Q: Preliminary analyses indicate that you can consider the assumptions for using nonpooled t-procedures…
A: Given datachronic Remittedx¯1=29.4 x¯2=24.5s1=4…
Q: 5. An average fee for an Information Technology Degree program at private universities in Malaysia…
A: Given average fee = 4081 N=100 Standard deviation =845 We have to calculate, 95%confidence interval…
Q: Situation: The Ipod Touch has been out for two years now and a lot of data has been collected.…
A: In this case the demand (y) is the dependent variable and price (x) is the independent variable.
Q: i. ii. Sketch the interaction plot. Clearly label both axes. Based on (i), does the plot suggest an…
A:
Q: P(z > -2.74) Express the probability as a decimal rounded to 4 decimal places.
A: We want to find, P(z > -2.74) Here, z ~ N(0,1)
Q: A particular fruit's weights are normally distributed, with a mean of 648 grams and a standard…
A: Given distribution is normally distributed Let, X: Fruit's weights Mean=μ=648 Standard…
Q: Indicate whether the variables concerned are Nominal, Ordinal, Interval, or Ratio No. Variables…
A: The objective is to indicate whether the variables concerned are Nominal, Ordinal, Interval, or…
Q: A health administration recommends that individuals consume 1000 mg of calcium daily. After an…
A: Given that n=40 ,s =100,x¯ =1020,α=0.05
Q: What type of sample do we usually prefer?
A: We have given that What type of sample do we usually prefer
Q: Which of the following plots is most useful for de O Box and whiskers plot O Frequency polygon O…
A: It is given that the statement about to the plot. Here, need to find out the correct choice for the…
Q: L7Q2. Find the probability of getting a tail when we toss a coin. A.1/4 B. 1/2 C. 3/4 D. All of the…
A:
Q: and y-intercepts of a line given the equation in standard form Find both the x-intercept and the…
A: Given data,The equation is 2.9x+9.9y-9.5=0Find both the x-intercept and the y-intercept
Q: onsider the following data. 14,6,−11,−6,5,1014,6,−11,−6,5,10 Copy Data Step 1 of 3: Determine…
A: data: 14,6,−11,−6,5,10,14,6,−11,−6,5,10 we have to find mean = ?
Q: A clinical trial was conducted to test the effectiveness of a drug used for treating insomnia in…
A: Given data: Sample size, n = 16 Sample mean, x¯=91.6 Sample standard deviation, s = 40.1 Confidence…
Q: The data show the chest size and weight of several bears. Find the regression equation, letting…
A: Given: n = 6 Formula Used: The Regression equation: Y = a + bX Slope b = n∑XY-∑X∑Yn∑X2-∑X2 Intercept…
Q: A study found that among the 2300 college students who drank energy drinks daily 850 of them binge…
A: Given:
Q: Use a table of areas to obtain the shaded area under the standard normal curve. -1.84 -0.92 A)…
A: In the given scenario, a standard normal curve was given to find the area of the shaded region. The…
Q: state are µ=$13,525 and o-$4,180, respectively. Suppose random samples of 100 are drawn from the…
A: A random sample of size 100 is drawn; n=100 The mean and standard deviation of vehicles is…
Q: The manager of a commuter rail transportation system was recently asked by her governing board to…
A: 1) The objective is to estimate a multiple regression equation using the given data.
Q: 5)The Internal Revenue Service reports that the mean federal income tax paid in the year was $8040.…
A: Given: Sample size,n= 1000 Mean,u= 8040 standard deviation σx= σ/√n=4800/√1000= 151.7893
Q: otheses Ho: P₁ for the hypothesis P₂
A: Here we have given the first sample to be the sample of male tennis player who challenged the…
Q: Given a Sample X₁ X₁ from a X, pdf of the form = f (ex-01/6), List at least five different pivotal…
A: Given: A sample X1, X2,.....,Xn from a pdf of the form 1σfx-θ/σ
Q: The sample is: O O O O the 25 Maryland-based treatment centers the medical records, insurance, and…
A: A group of items or things under study is known as the population. The technique of drawing a sample…
Q: A simple random sample from a population with a normal distribution of 105 body temperatures has…
A: Given n=random sample=105 Mean=X=98.30 Standard deviation=s=0.63 Confidence interval=99%
Q: is there evidence that the mean life is different from 7520 hours? What is the test statistic?…
A: It is given that Population mean = 7520 Sample mean = 7310 Population standard deviation = 980…
Q: SRS of 25 commuters to the Washington DC re selected, and each is asked how far they ommute to work…
A: Given data,n=25The sample mean x=39Sample sd s=6Construct 90% CI?
Q: confidence level of 99% with a sample size of 28, find the critical t value.
A: Given data, Sample size n=28 confidence level =99% =0.01 find the critical t value.
Q: The mean area of the several thousand apartments in a new development by a certain builder is…
A:
Q: relative risk (risk ratio)
A: A) Relative risk or risk ratio or rate ratio is the ratio of the probability of a particular event…
Q: Question: Is desirability of professional development different between managers and employees? •H0:…
A: Given: Significance level α = 0.05 Test-statistic t = 2.01 Degree of freedom df = 48 p-value = 0.048…
Q: Find the false positive rate and the false
A: here given , A medical research team wished to evaluate a proposed screening for diabetes. The test…
Q: Many students over the last couple of years have been earning money as social networking service…
A: Confidence interval is used to estimate the range where the true population can happen. Prediction…
Q: An IQ test is designed so that the mean is 100 and the standard deviation is 17 for the population…
A: Given dataσ=17M.E=3confidence interval=90%
Q: 41% adults favor the use of unmanned drones by police agencies. Twelve U.S. adults are randomly…
A: Givenp=0.41n=12Let "x" be no. of U.S. adults who favor the use of unmanned drones by police…
Q: ers", as defined by a profe anization, was questioned
A: From the random sample of 2000 likely voters 1116 felt that the economy state was the most urgent…
Q: Assume that a sample is used to estimate a population proportion p. Find the 80% confidence interval…
A: Given data n=300 x=189 confidence interval is 80%
Q: Employers want to know which days of the week employees are absent in a five-day workweek. Most…
A: Given : Day No. of Absences Monday 6 Tuesday 4 Wednesday 15 Thursday 3 Friday 7…
Q: Provided below are summary statistics for independent simple random samples from two populations.…
A: Given that: Sample means: x¯1=20x¯2=29 Sample sizes: n1=15 n2=25 Sample standard deviations: s1=5…
Q: 5. Identify the measure of central tendency that is most appropriate to determine the following:…
A: The following are the solution of the above question.
Q: 1. The mass of ducks is normally distributed with mean 1.3 kg and standard deviation 0.6 kg. 15…
A:
Q: An investor believes that the yields of his mutual funds have a normal distribution with an average…
A: The question is about normal dist. Given : Avg. yield ( μ ) = 10 % Std. deviation of yield ( σ ) = 2…
Q: L6Q4.If A and B are dependent events, to find the probability that the two dependent events would…
A: Dependent events:Two events are said to be dependent when the outcomeof the first event influences…
Q: Indicate whether the variables Discrete or Continuous No. Variables Classification 1 The height…
A: Since you have posted a question with multiple sub-parts, we will solve first three subparts for…
Q: A large sports team claims that, on average, 13000 fans attend a game at their stadium. A company…
A: Given information Sample mean x̅ = 14900 Population mean µ = 13000 Sample size n = 19 Standard…
Need help urgently please
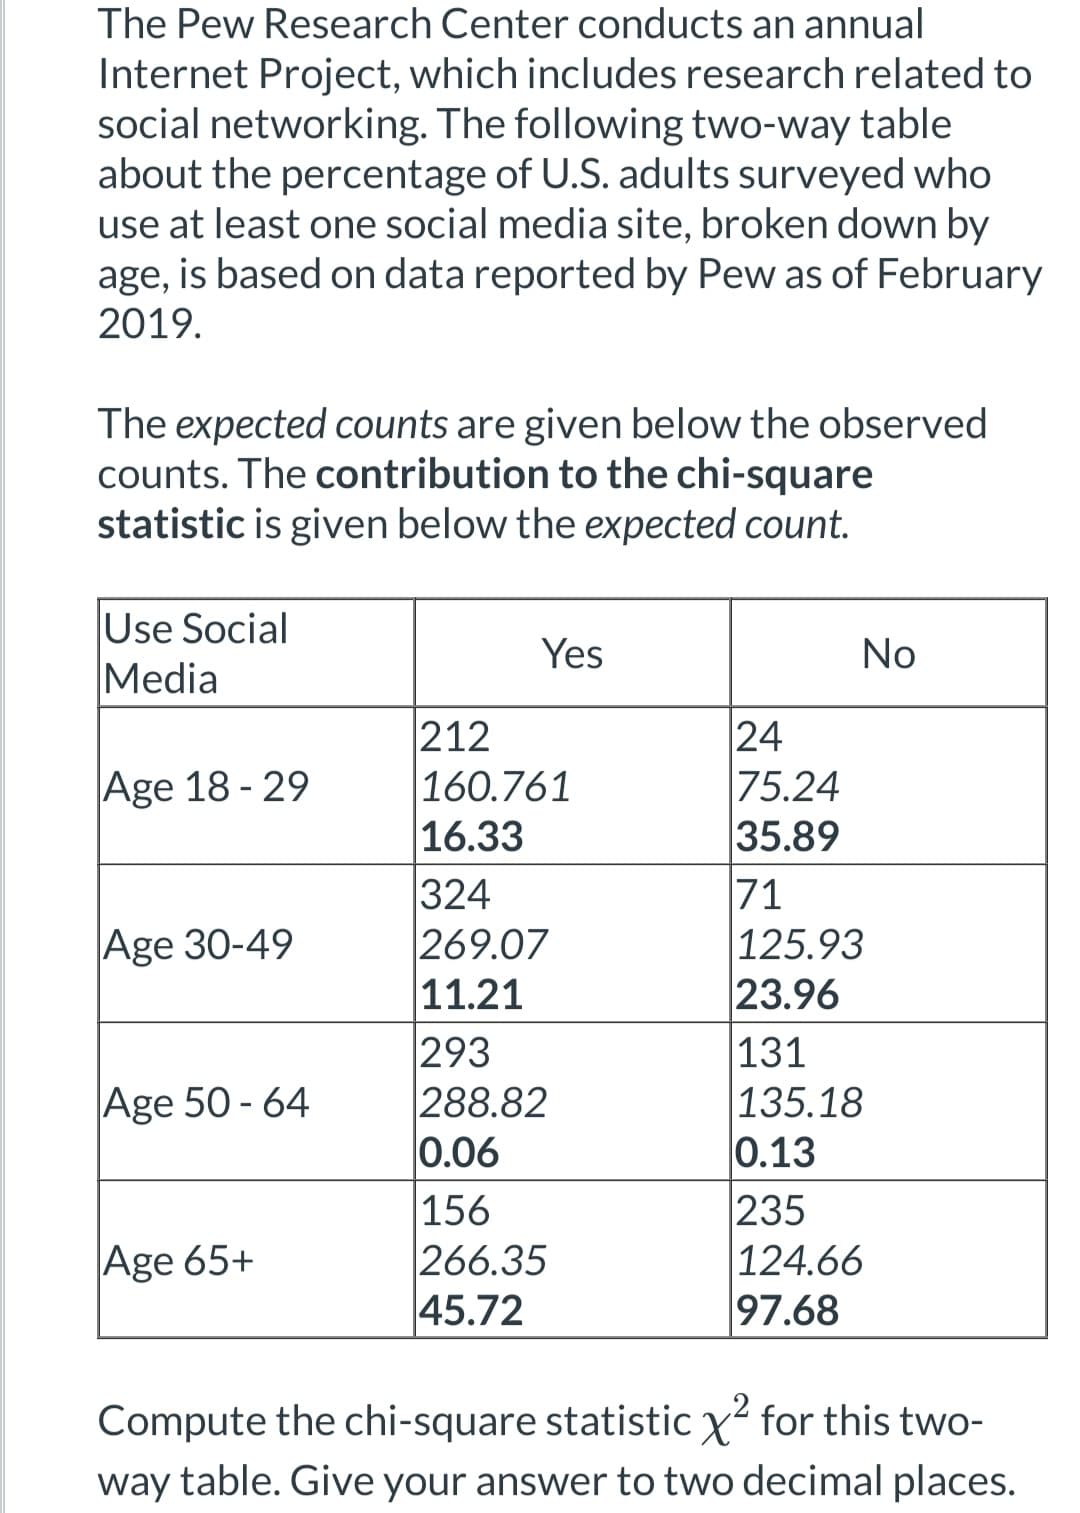
Step by step
Solved in 3 steps
- If a researcher did not wish to assume homogeneity of variance for this analysis, which values would they report for the t-statistic, degrees of freedom, and p-value? Would the conclusions change?A financial analyst conducted a test to determine whether the rates of return per share of Netflix stock exceeded the rates of return per share of Microsoft stock over the last 15 quarters, on average. Assuming equal population variances, if the calculated value for the associated test statistic equalled -1.9921, what did the p-value equal?Suppose an architectural firm specializing in the structural restoration and renovation of historic homes and early barns is deciding whether to open a branch of the company in Wilmington, Vermont. Market research commissioned by the firm indicates that the Vermont location will be profitable only if the mean age of houses and barns located within a 100-mile radius of Wilmington is greater than 65 years. The architectural firm conducts a hypothesis test to determine whether μ, the mean age of structures located within a 100-mile radius of Wilmington, is greater than 65 years. The test is conducted at α = 0.01 level of significance using a random sample of n = 196 houses and barns located in the specified area. The population standard deviation of the age of structures is assumed to be known with a value of σ = 23.8 years. The firm will open a Vermont branch only if it rejects the null hypothesis that the mean age of structures in the specified area is less than or equal to 65 years. To…
- An analysis of variances produces dftotal = 35 and dfwithin = 28. For this analysis, what is dfbetween? Round your answer to the nearest whole number.At the 0.05 level of significance, does the data provide evidence to suggest that consumers in the Northeast spend more on average than the national average reported in the Bureau of Labor Statistics? Select the correct hypothesis test for this problem:The article “Well-Fed Crickets Bowl Maidens Over” (Nature Science Update, February 11, 1999) reported that female field crickets are attracted to males with high chirp rates and hypothesized that chirp rate is related to nutritional status. The usual chirp rate for male field crickets was reported to vary around a mean of 60 chirps per second. To investigate whether the chirp rate was related to nutritional status, investigators fed 27 male crickets a high protein diet for 8 days, after which chirp rate was measured. Let: The parameter μ be the mean chirp rateof male crickets on a high protein diet for 8 days. Given: The mean chirp rate for the random sample of crickets on the high protein diet was reported to be 64 chirps per second with a standard deviation of 14. Research Question: Is there convincing evidence that the mean chirp rate for crickets on a high protein diet implies an advantage in attracting the ladies? It is known that the researchers did not want to risk a…
- The r2represents the shared variance between a predictor and _______It turns out that the survey study at the U of M sampled students from a single student residence hall. Explain why sampling students from a single residence hall would have an impact on the external validity of the study.The article “Well-Fed Crickets Bowl Maidens Over” (Nature Science Update, February 11, 1999) reported that female field crickets are attracted to males with high chirp rates and hypothesized that chirp rate is related to nutritional status. The usual chirp rate for male field crickets was reported to vary around a mean of 60 chirps per second. To investigate whether the chirp rate was related to nutritional status, investigators fed 22 male crickets a high protein diet for 8 days, after which chirp rate was measured. Let: The parameter μμ be the mean chirp rateof male crickets on a high protein diet for 8 days. Given: The mean chirp rate for the random sample of crickets on the high protein diet was reported to be 65.32 chirps per second with a standard deviation of 12. Research Question: Is there convincing evidence that the mean chirp rate for crickets on a high protein diet implies an advantage in attracting the ladies? It is known that the researchers did not want to…
- The article “Well-Fed Crickets Bowl Maidens Over” (Nature Science Update, February 11, 1999) reported that female field crickets are attracted to males with high chirp rates and hypothesized that chirp rate is related to nutritional status. The usual chirp rate for male field crickets was reported to vary around a mean of 60 chirps per second. To investigate whether the chirp rate was related to nutritional status, investigators fed 22 male crickets a high protein diet for 8 days, after which chirp rate was measured. Let: The parameter μμ be the mean chirp rateof male crickets on a high protein diet for 8 days. Given: The mean chirp rate for the random sample of crickets on the high protein diet was reported to be 65.32 chirps per second with a standard deviation of 12. Research Question: Is there convincing evidence that the mean chirp rate for crickets on a high protein diet implies an advantage in attracting the ladies? It is known that the researchers did not want to…The article “Well-Fed Crickets Bowl Maidens Over” (Nature Science Update, February 11, 1999) reported that female field crickets are attracted to males with high chirp rates and hypothesized that chirp rate is related to nutritional status. The usual chirp rate for male field crickets was reported to vary around a mean of 60 chirps per second. To investigate whether the chirp rate was related to nutritional status, investigators fed 26 male crickets a high protein diet for 8 days, after which chirp rate was measured. Let: The parameter μ be the mean chirp rateof male crickets on a high protein diet for 8 days. Given: The mean chirp rate for the random sample of crickets on the high protein diet was reported to be 64.04 chirps per second with a standard deviation of 10. Research Question: Is there convincing evidence that the mean chirp rate for crickets on a high protein diet implies an advantage in attracting the ladies? It is known that the researchers did not want to…As a marketing class term project, Jim is investigating whether senior students eat less frequently in fast-food chains than college freshmen. He asked 11 freshmen and 11 seniors to keep track of how many times they ate in a fast-food restaurant during the month of November. Assuming equal variances unknown, do a left-tailed test of Hypothesis whether he conclude that the mean is significantly smaller for college seniors than freshmen at the 5% level of significance. [Freshmen(F) -> 11 18 12 7 16 20 15 14 17 9 16 Senior(S) => 5 13 15 5 10 8 9 8 19 7 18 a) Carry out the hypothesis test above and draw the conclusion of the test, where S-mean = 10.64, F-mean = 14.09, S-variance = 24.25, F-variance = 15.69 b) What is the p-value for left-tailed test in a) -> used by z table (use up to 2nd decimal point value of tr, in a).