Use the given data to find the equation of the regression line. Examine the scatterplot and identify a characteristic of the data that is ignored by the regression line. 12 13 17.86 14 6 17.11 18.00 17.35 11 17.74 14.71 х 10 y 16.11 12.94 5.35 10.80 8.26 y = + x (Round to two decimal places as needed.) Create a scatterplot of the data. Choose the correct graph below. OA OR O. On 25- лу 25- АУ 25- 25- 20 20 203 20 155 15 155 155 10 103 105 10- 55 52 52 х х 0- 05 10 15 20 25 0- 05 10 15 20 25 04 05 10 15 20 25 0- 05 10 15 20 25 Identify a characteristic of the data that is ignored by the regression line. OA. The data has a pattern that is not a staight line. OB. There is no trend in the data. Oc. There is an influential point that strongly affects the graph of the regression line. OD. There is no characteristic of the data that is ignored by the regression line. ০০০০০ FO ఇ000000000
Use the given data to find the equation of the regression line. Examine the scatterplot and identify a characteristic of the data that is ignored by the regression line. 12 13 17.86 14 6 17.11 18.00 17.35 11 17.74 14.71 х 10 y 16.11 12.94 5.35 10.80 8.26 y = + x (Round to two decimal places as needed.) Create a scatterplot of the data. Choose the correct graph below. OA OR O. On 25- лу 25- АУ 25- 25- 20 20 203 20 155 15 155 155 10 103 105 10- 55 52 52 х х 0- 05 10 15 20 25 0- 05 10 15 20 25 04 05 10 15 20 25 0- 05 10 15 20 25 Identify a characteristic of the data that is ignored by the regression line. OA. The data has a pattern that is not a staight line. OB. There is no trend in the data. Oc. There is an influential point that strongly affects the graph of the regression line. OD. There is no characteristic of the data that is ignored by the regression line. ০০০০০ FO ఇ000000000

Functions and Change: A Modeling Approach to College Algebra (MindTap Course List)
6th Edition
ISBN:9781337111348
Author:Bruce Crauder, Benny Evans, Alan Noell
Publisher:Bruce Crauder, Benny Evans, Alan Noell
Chapter5: A Survey Of Other Common Functions
Section5.6: Higher-degree Polynomials And Rational Functions
Problem 1TU: The following fictitious table shows kryptonite price, in dollar per gram, t years after 2006. t=...

Related questions
Question
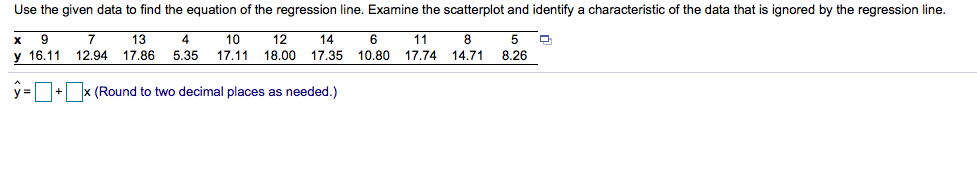
Transcribed Image Text:Use the given data to find the equation of the regression line. Examine the scatterplot and identify a characteristic of the data that is ignored by the regression line.
12
13
17.86
14
6
17.11 18.00 17.35
11
17.74
14.71
х
10
y 16.11 12.94
5.35
10.80
8.26
y = + x (Round to two decimal places as needed.)
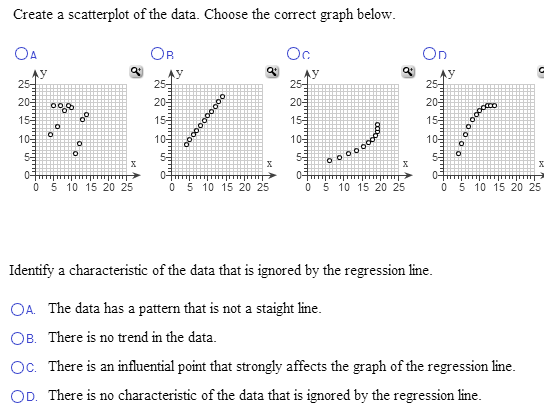
Transcribed Image Text:Create a scatterplot of the data. Choose the correct graph below.
OA
OR
O.
On
25-
лу
25-
АУ
25-
25-
20
20
203
20
155
15
155
155
10
103
105
10-
55
52
52
х
х
0-
05 10 15 20 25
0-
05 10 15 20 25
04
05 10 15 20 25
0-
05 10 15 20 25
Identify a characteristic of the data that is ignored by the regression line.
OA. The data has a pattern that is not a staight line.
OB. There is no trend in the data.
Oc. There is an influential point that strongly affects the graph of the regression line.
OD. There is no characteristic of the data that is ignored by the regression line.
০০০০০
FO
ఇ000000000
Expert Solution
This question has been solved!
Explore an expertly crafted, step-by-step solution for a thorough understanding of key concepts.

This is a popular solution!

Trending now
This is a popular solution!

Step by step
Solved in 2 steps with 3 images

Recommended textbooks for you
Functions and Change: A Modeling Approach to Coll…
Algebra
ISBN:
9781337111348
Author:
Bruce Crauder, Benny Evans, Alan Noell
Publisher:
Cengage Learning

College Algebra
Algebra
ISBN:
9781305115545
Author:
James Stewart, Lothar Redlin, Saleem Watson
Publisher:
Cengage Learning
Functions and Change: A Modeling Approach to Coll…
Algebra
ISBN:
9781337111348
Author:
Bruce Crauder, Benny Evans, Alan Noell
Publisher:
Cengage Learning
College Algebra
Algebra
ISBN:
9781305115545
Author:
James Stewart, Lothar Redlin, Saleem Watson
Publisher:
Cengage Learning