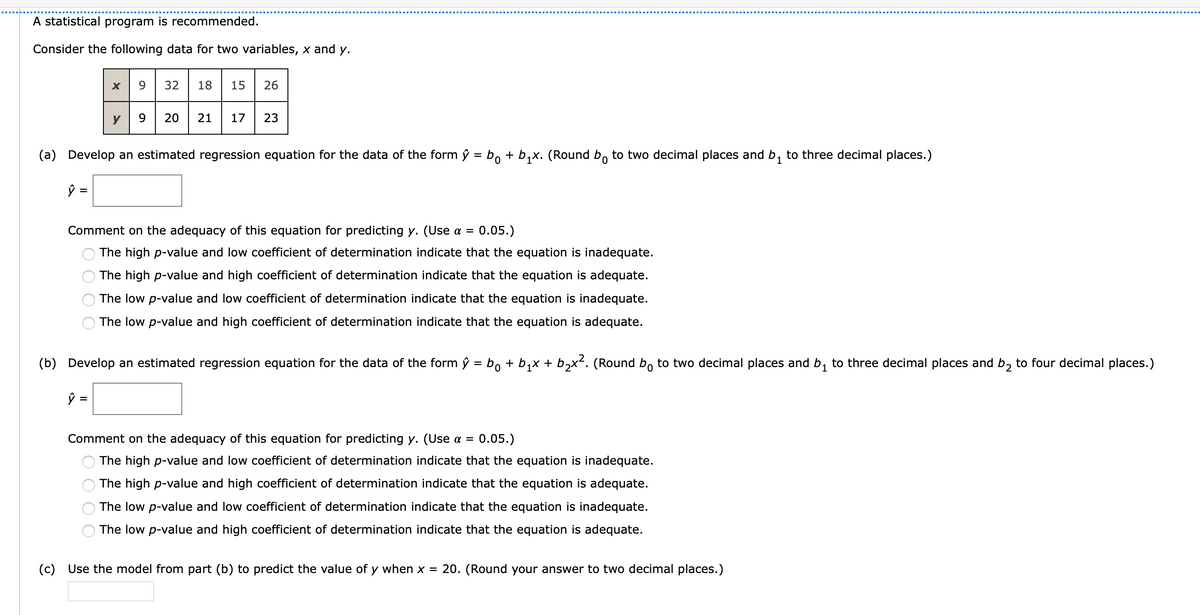
Consider the following data for two variables, x and y. x 9 32 | 18 15 26 y 9 20 21 17 23 (a) Develop an estimated regression equation for the data of the form ŷ = bo + b,x. (Round b, to two decimal places and b, to three decimal places.) Comment on the adequacy of this equation for predicting y. (Use a = 0.05.) O The high p-value and low coefficient of determination indicate that the equation is inadequate. O The high p-value and high coefficient of determination indicate that the equation is adequate. O The low p-value and low coefficient of determination indicate that the equation is inadequate. O The low p-value and high coefficient of determination indicate that the equation is adequate. (b) Develop an estimated regression equation for the data of the form ŷ = bo + b,x + b,x2. (Round b, to two decimal places and b, to three decimal places and b, to four decimal

MATLAB: An Introduction with Applications
6th Edition
ISBN:9781119256830
Author:Amos Gilat
Publisher:Amos Gilat
Chapter1: Starting With Matlab
Section: Chapter Questions
Problem 1P
icon
Related questions
icon
Concept explainers
Question
A statistical program is recommended.
Consider the following data for two variables, x and y.
32
18
15
26
y
9.
20
21
17
23
(a) Develop an estimated regression equation for the data of the form ŷ = bo + b,x. (Round b, to two decimal places and b, to three decimal places.)
1
Comment on the adequacy of this equation for predicting y. (Use a =
0.05.)
The high p-value and low coefficient of determination indicate that the equation is inadequate.
The high p-value and high coefficient of determination indicate that the equation is adequate.
The low p-value and low coefficient of determination indicate that the equation is inadequate.
The low p-value and high coefficient of determination indicate that the equation is adequate.
(b) Develop an estimated regression equation for the data of the form ŷ = bo + b,x + b,x². (Round b, to two decimal places and b, to three decimal places and b, to four decimal places.)
Comment on the adequacy of this equation for predicting y. (Use a = 0.05.)
The high p-value and low coefficient of determination indicate that the equation is inadequate.
The high p-value and high coefficient of determination indicate that the equation is adequate.
The low p-value and low coefficient of determination indicate that the equation is inadequate.
The low p-value and high coefficient of determination indicate that the equation is adequate.
(c) Use the model from part (b) to predict the value of y when x = 20. (Round your answer to two decimal places.)
Transcribed Image Text:A statistical program is recommended. Consider the following data for two variables, x and y. 32 18 15 26 y 9. 20 21 17 23 (a) Develop an estimated regression equation for the data of the form ŷ = bo + b,x. (Round b, to two decimal places and b, to three decimal places.) 1 Comment on the adequacy of this equation for predicting y. (Use a = 0.05.) The high p-value and low coefficient of determination indicate that the equation is inadequate. The high p-value and high coefficient of determination indicate that the equation is adequate. The low p-value and low coefficient of determination indicate that the equation is inadequate. The low p-value and high coefficient of determination indicate that the equation is adequate. (b) Develop an estimated regression equation for the data of the form ŷ = bo + b,x + b,x². (Round b, to two decimal places and b, to three decimal places and b, to four decimal places.) Comment on the adequacy of this equation for predicting y. (Use a = 0.05.) The high p-value and low coefficient of determination indicate that the equation is inadequate. The high p-value and high coefficient of determination indicate that the equation is adequate. The low p-value and low coefficient of determination indicate that the equation is inadequate. The low p-value and high coefficient of determination indicate that the equation is adequate. (c) Use the model from part (b) to predict the value of y when x = 20. (Round your answer to two decimal places.)
Expert Solution
trending now

Trending now

This is a popular solution!

steps

Step by step

Solved in 3 steps with 3 images

Blurred answer
Knowledge Booster
Correlation, Regression, and Association
Learn more about
Need a deep-dive on the concept behind this application? Look no further. Learn more about this topic, statistics and related others by exploring similar questions and additional content below.
Similar questions
  • SEE MORE QUESTIONS
Recommended textbooks for you
MATLAB: An Introduction with Applications
Statistics
ISBN:
9781119256830
Author:
Amos Gilat
Publisher:
John Wiley & Sons Inc
Probability and Statistics for Engineering and th…
Statistics
ISBN:
9781305251809
Author:
Jay L. Devore
Publisher:
Cengage Learning
Statistics for The Behavioral Sciences (MindTap C…
Statistics
ISBN:
9781305504912
Author:
Frederick J Gravetter, Larry B. Wallnau
Publisher:
Cengage Learning
Elementary Statistics: Picturing the World (7th E…
Statistics
ISBN:
9780134683416
Author:
Ron Larson, Betsy Farber
Publisher:
PEARSON
The Basic Practice of Statistics
Statistics
ISBN:
9781319042578
Author:
David S. Moore, William I. Notz, Michael A. Fligner
Publisher:
W. H. Freeman
Introduction to the Practice of Statistics
Statistics
ISBN:
9781319013387
Author:
David S. Moore, George P. McCabe, Bruce A. Craig
Publisher:
W. H. Freeman