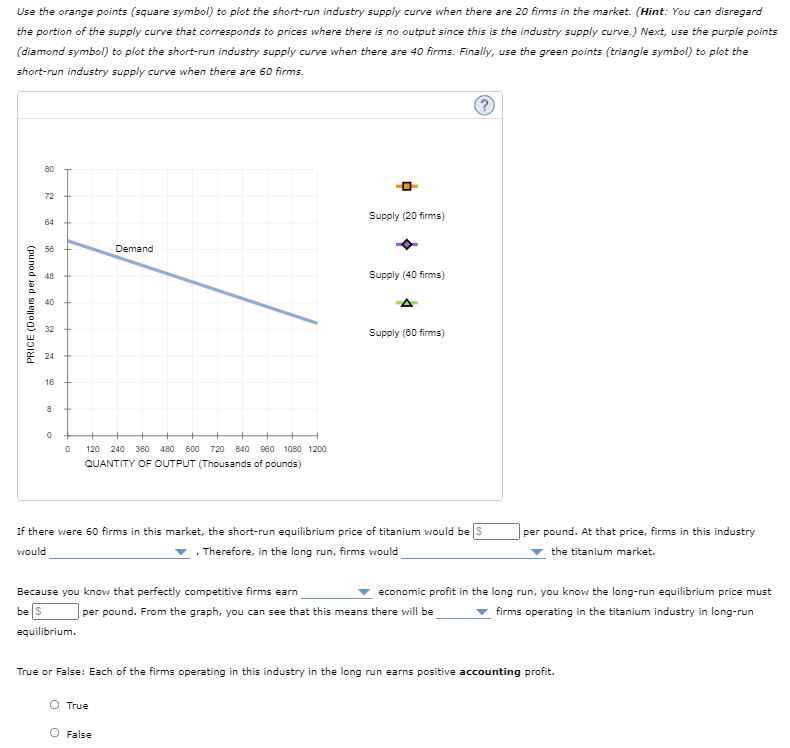
Use the orange points (square symbol) to plot the short-run industry supply curve when there are 20 firms in the market. (Hint: You can disregard the portion of the supply curve that corresponds to prices where there is no output since this is the industry supply curve.) Next, use the purple points (diamond symbol) to plot the short-run industry supply curve when there are 40 firms. Finally, use the green points (triangle symbol) to plot the short-run industry supply curve when there are 60 firms.
Use the orange points (square symbol) to plot the short-run industry supply curve when there are 20 firms in the market. (Hint: You can disregard the portion of the supply curve that corresponds to prices where there is no output since this is the industry supply curve.) Next, use the purple points (diamond symbol) to plot the short-run industry supply curve when there are 40 firms. Finally, use the green points (triangle symbol) to plot the short-run industry supply curve when there are 60 firms.

Chapter19: Externalities And Public Goods
Section: Chapter Questions
Problem 19.1P: A firm in a perfectly competitive industry has patented a newprocess for making widgets. The new...

Related questions
Question
Transcribed Image Text:Use the orange points (square symbol) to plot the short-run industry supply curve when there are 20 firms in the market. (Hint: You can disregard
the portion of the supply curve that corresponds to prices where there is no output since this is the industry supply curve.) Next, use the purple points
(diamond symbol) to plot the short-run industry supply curve when there are 40 firms. Finally, use the green points (triangle symbol) to plot the
short-run industry supply curve when there are 60 firms.
80
72
Supply (20 firms)
64
56
Demand
48
Supply (40 firms)
40
32
Supply (80 firms)
24
16
120
240 360 480 600
720
840
960 1080 1200
QUANTITY OF OUTPUT (Thousands of pounds)
If there were 60 firms in this market, the short-run equilibrium price of titanium would be s
per pound. At that price, firms in this industry
would
Therefore, in the long run, firms would
the titanium market.
Because you know that perfectly competitive firms earn
economic profit in the long run, you know the long-run equilibrium price must
be $
per pound. From the graph, you can see that this means there will be
firms operating in the titanium industry in long-run
equilibrium.
True or False: Each of the firms operating in this industry in the long run earns positive accounting profit.
O True
O False
PRICE (Dollars per pound)
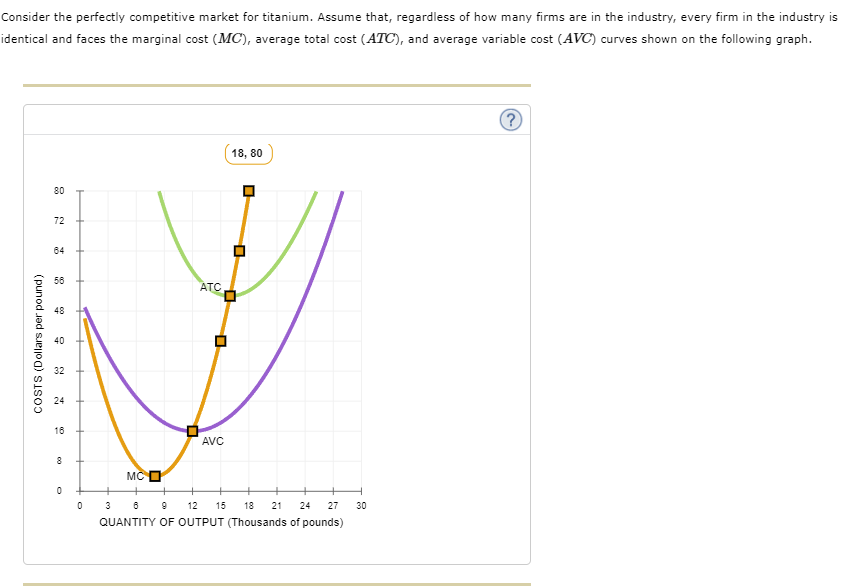
Transcribed Image Text:Consider the perfectly competitive market for titanium. Assume that, regardless of how many firms are in the industry, every firm in the industry is
identical and faces the marginal cost (MC), average total cost (ATC), and average variable cost (AVC) curves shown on the following graph.
18, 80
80
72
64
56
ATC
48
40
32
24
16
AVC
8
+
MC O
3
12
15
18
21
24
27
30
QUANTITY OF OUTPUT (Thousands of pounds)
COSTS (Dollars per pound)
Expert Solution
This question has been solved!
Explore an expertly crafted, step-by-step solution for a thorough understanding of key concepts.

This is a popular solution!

Trending now
This is a popular solution!

Step by step
Solved in 4 steps with 1 images

Recommended textbooks for you

Economics: Private and Public Choice (MindTap Cou…
Economics
ISBN:
9781305506725
Author:
James D. Gwartney, Richard L. Stroup, Russell S. Sobel, David A. Macpherson
Publisher:
Cengage Learning

Microeconomics: Private and Public Choice (MindTa…
Economics
ISBN:
9781305506893
Author:
James D. Gwartney, Richard L. Stroup, Russell S. Sobel, David A. Macpherson
Publisher:
Cengage Learning
Economics: Private and Public Choice (MindTap Cou…
Economics
ISBN:
9781305506725
Author:
James D. Gwartney, Richard L. Stroup, Russell S. Sobel, David A. Macpherson
Publisher:
Cengage Learning
Microeconomics: Private and Public Choice (MindTa…
Economics
ISBN:
9781305506893
Author:
James D. Gwartney, Richard L. Stroup, Russell S. Sobel, David A. Macpherson
Publisher:
Cengage Learning