Which of the following statements is not true? A. In general, you can reject the null hypothesis when x is very large. B. A segmented bar graph is useful in observing when two variables may be independent. C. For a chi-square test of independence, the larger the x' statistic, the weaker the association between the two variables. 6. D. In general, a very large x value matches with a very small, and significant, P-value.
Which of the following statements is not true? A. In general, you can reject the null hypothesis when x is very large. B. A segmented bar graph is useful in observing when two variables may be independent. C. For a chi-square test of independence, the larger the x' statistic, the weaker the association between the two variables. 6. D. In general, a very large x value matches with a very small, and significant, P-value.

MATLAB: An Introduction with Applications
6th Edition
ISBN:9781119256830
Author:Amos Gilat
Publisher:Amos Gilat
Chapter1: Starting With Matlab
Section: Chapter Questions
Problem 1P

Related questions
Question
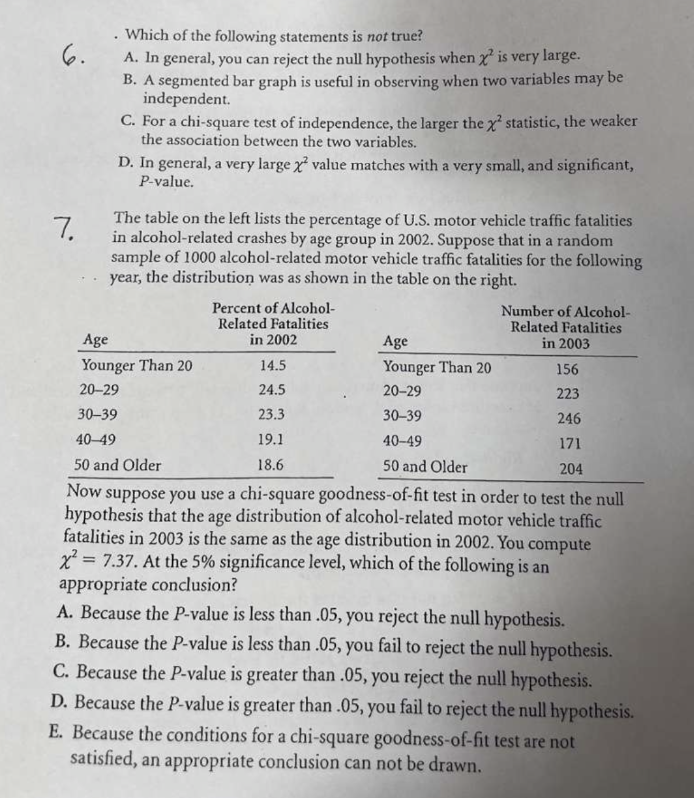
Transcribed Image Text:Which of the following statements is not true?
A. In general, you can reject the null hypothesis when x' is very large.
B. A segmented bar graph is useful in observing when two variables may be
independent.
C. For a chi-square test of independence, the larger the x statistic, the weaker
the association between the two variables.
6.
D. In general, a very large x value matches with a very small, and significant,
P-value.
7.
The table on the left lists the percentage of U.S. motor vehicle traffic fatalities
in alcohol-related crashes by age group in 2002. Suppose that in a random
sample of 1000 alcohol-related motor vehicle traffic fatalities for the following
year, the distribution was as shown in the table on the right.
Percent of Alcohol-
Related Fatalities
in 2002
Number of Alcohol-
Related Fatalities
in 2003
Age
Age
Younger Than 20
14.5
Younger Than 20
156
20-29
24.5
20-29
223
30-39
23.3
30-39
246
40-49
19.1
40-49
171
50 and Older
18.6
50 and Older
204
Now suppose you use a chi-square goodness-of-fit test in order to test the null
hypothesis that the age distribution of alcohol-related motor vehicle traffic
fatalities in 2003 is the same as the age distribution in 2002. You compute
x2 = 7.37. At the 5% significance level, which of the following is an
appropriate conclusion?
A. Because the P-value is less than .05, you reject the null hypothesis.
B. Because the P-value is less than .05, you fail to reject the null hypothesis.
C. Because the P-value is greater than .05, you reject the null hypothesis.
D. Because the P-value is greater than .05, you fail to reject the null hypothesis.
E. Because the conditions for a chi-square goodness-of-fit test are not
satisfied, an appropriate conclusion can not be drawn.
Expert Solution
This question has been solved!
Explore an expertly crafted, step-by-step solution for a thorough understanding of key concepts.

This is a popular solution!

Trending now
This is a popular solution!

Step by step
Solved in 2 steps

Recommended textbooks for you
MATLAB: An Introduction with Applications
Statistics
ISBN:
9781119256830
Author:
Amos Gilat
Publisher:
John Wiley & Sons Inc

Probability and Statistics for Engineering and th…
Statistics
ISBN:
9781305251809
Author:
Jay L. Devore
Publisher:
Cengage Learning

Statistics for The Behavioral Sciences (MindTap C…
Statistics
ISBN:
9781305504912
Author:
Frederick J Gravetter, Larry B. Wallnau
Publisher:
Cengage Learning
MATLAB: An Introduction with Applications
Statistics
ISBN:
9781119256830
Author:
Amos Gilat
Publisher:
John Wiley & Sons Inc
Probability and Statistics for Engineering and th…
Statistics
ISBN:
9781305251809
Author:
Jay L. Devore
Publisher:
Cengage Learning
Statistics for The Behavioral Sciences (MindTap C…
Statistics
ISBN:
9781305504912
Author:
Frederick J Gravetter, Larry B. Wallnau
Publisher:
Cengage Learning

Elementary Statistics: Picturing the World (7th E…
Statistics
ISBN:
9780134683416
Author:
Ron Larson, Betsy Farber
Publisher:
PEARSON

The Basic Practice of Statistics
Statistics
ISBN:
9781319042578
Author:
David S. Moore, William I. Notz, Michael A. Fligner
Publisher:
W. H. Freeman

Introduction to the Practice of Statistics
Statistics
ISBN:
9781319013387
Author:
David S. Moore, George P. McCabe, Bruce A. Craig
Publisher:
W. H. Freeman