Use the same scales to construct boxplots for the pulse rates of males and females from the accompanying data sets. Use the boxplots to compare the two data sets. E Click the icon to view the data sets. 40 50 60 70 80 90 100110 40 50 60 70 80 90 100110 C. Q 40 50 60 70 80 90 100110 40 50 60 70 80 90 100110 Determine the boxplot for the women's boxplot data. O A. ов. 40 50 60 70 80 90 100110 40 50 60 70 80 90 100110 Oc. OD.
Use the same scales to construct boxplots for the pulse rates of males and females from the accompanying data sets. Use the boxplots to compare the two data sets. E Click the icon to view the data sets. 40 50 60 70 80 90 100110 40 50 60 70 80 90 100110 C. Q 40 50 60 70 80 90 100110 40 50 60 70 80 90 100110 Determine the boxplot for the women's boxplot data. O A. ов. 40 50 60 70 80 90 100110 40 50 60 70 80 90 100110 Oc. OD.

Glencoe Algebra 1, Student Edition, 9780079039897, 0079039898, 2018
18th Edition
ISBN:9780079039897
Author:Carter
Publisher:Carter
Chapter10: Statistics
Section10.5: Comparing Sets Of Data
Problem 14PPS

Related questions

Question
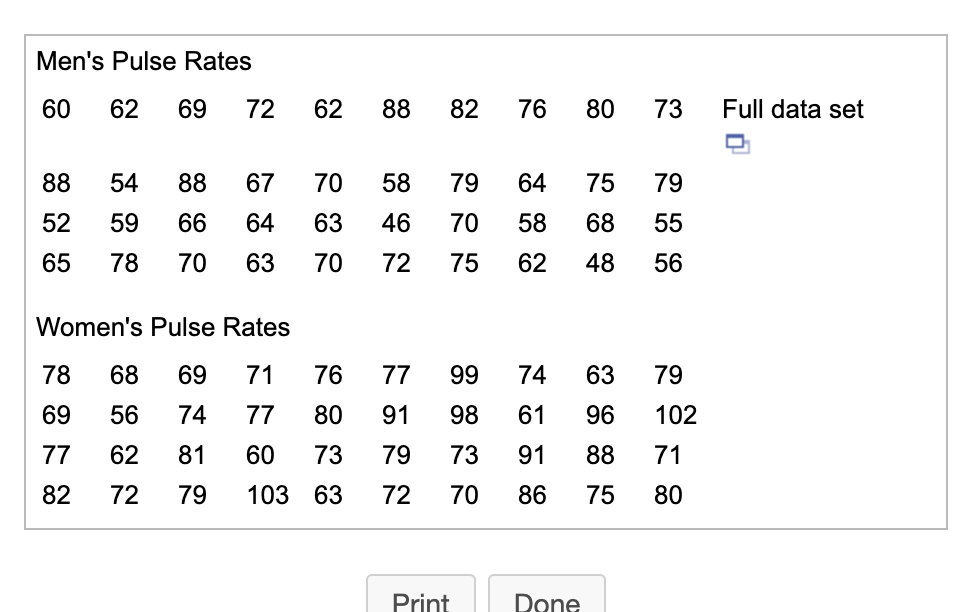
Transcribed Image Text:Men's Pulse Rates
60
62
69
72
62
88
82
76
80
73
Full data set
88
54
88
67
70
58
79
64
75
79
52
59
66
64
63
46
70
58
68
55
65
78
70
63
70
72
75
62
48
56
Women's Pulse Rates
78
68
69
71
76
77
99
74
63
79
69
56
74
77
80
91
98
61
96
102
77
62
81
60
73
79
73
91
88
71
82
72
79
103 63
72
70
86
75
80
Print
Done
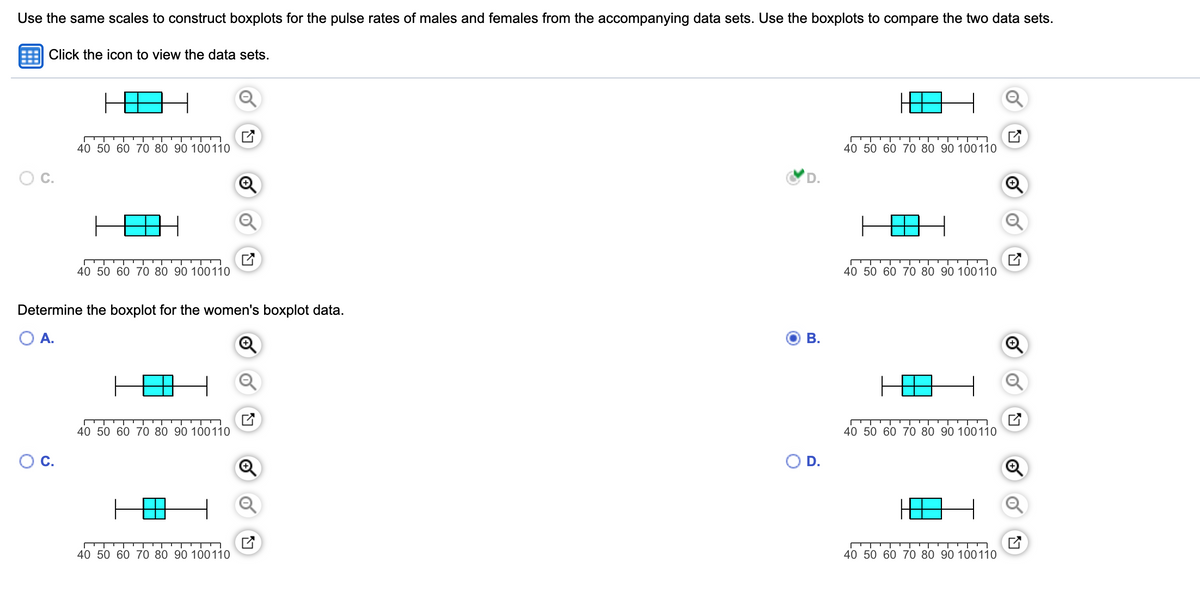
Transcribed Image Text:Use the same scales to construct boxplots for the pulse rates of males and females from the accompanying data sets. Use the boxplots to compare the two data sets.
Click the icon to view the data sets.
40 50 60 70 80 90 100110
40 50 60 70 80 90 100110
OC.
D.
40 50 60 70 80 90 100110
40 50 60 70 80 90 100110
Determine the boxplot for the women's boxplot data.
A.
В.
40 50 60 70 80 90 100110
40 50 60 70 80 90 100110
OC.
OD.
40 50 60 70 80 90 100110
40 50 60 70 80 90 100110
Expert Solution
This question has been solved!
Explore an expertly crafted, step-by-step solution for a thorough understanding of key concepts.

Step by step
Solved in 2 steps with 2 images

Knowledge Booster


Learn more about
Need a deep-dive on the concept behind this application? Look no further. Learn more about this topic, statistics and related others by exploring similar questions and additional content below.Recommended textbooks for you
Glencoe Algebra 1, Student Edition, 9780079039897…
Algebra
ISBN:
9780079039897
Author:
Carter
Publisher:
McGraw Hill

Big Ideas Math A Bridge To Success Algebra 1: Stu…
Algebra
ISBN:
9781680331141
Author:
HOUGHTON MIFFLIN HARCOURT
Publisher:
Houghton Mifflin Harcourt

Holt Mcdougal Larson Pre-algebra: Student Edition…
Algebra
ISBN:
9780547587776
Author:
HOLT MCDOUGAL
Publisher:
HOLT MCDOUGAL
Glencoe Algebra 1, Student Edition, 9780079039897…
Algebra
ISBN:
9780079039897
Author:
Carter
Publisher:
McGraw Hill
Big Ideas Math A Bridge To Success Algebra 1: Stu…
Algebra
ISBN:
9781680331141
Author:
HOUGHTON MIFFLIN HARCOURT
Publisher:
Houghton Mifflin Harcourt
Holt Mcdougal Larson Pre-algebra: Student Edition…
Algebra
ISBN:
9780547587776
Author:
HOLT MCDOUGAL
Publisher:
HOLT MCDOUGAL