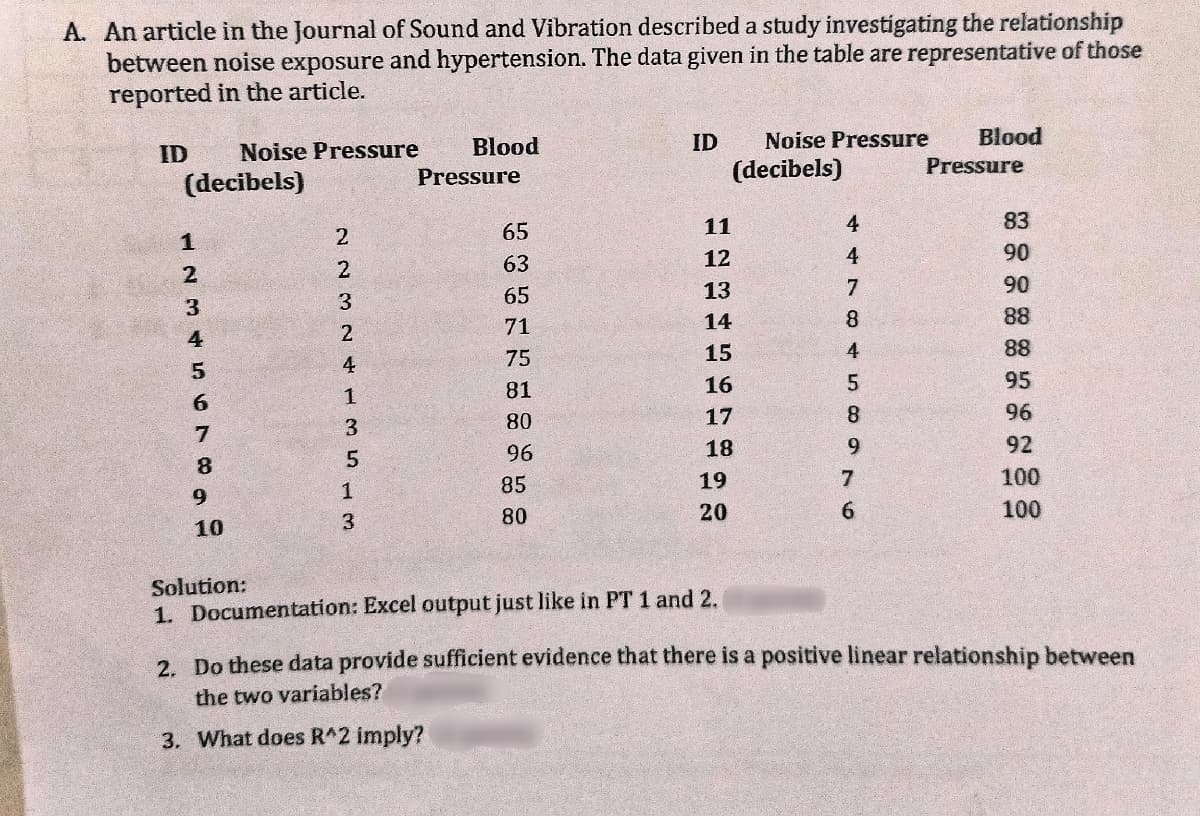
A. An article in the Journal of Sound and Vibration describeda study investigating the relationship between noise exposure and hypertension. The data given in the table are representative of those reported in the article. Blood ID Noise Pressure Blood ID Noise Pressure Pressure (decibels) Pressure (decibels) 65 11 4 83 1 12 4 90 63 2 65 13 7 90 3 3 71 14 8. 88 4 2. 15 4 88 4 75 81 16 95 1 80 17 8. 96 7 3 96 18 9. 92 8 85 19 7 100 9 1 80 20 6. 100 10 3. Solution: 1. Documentation: Excel output just like in PT 1 and 2. 2. Do these data provide sufficient evidence that there is a positive linear relationship between the two variables? 3. What does R^2 imply?

Functions and Change: A Modeling Approach to College Algebra (MindTap Course List)
6th Edition
ISBN:9781337111348
Author:Bruce Crauder, Benny Evans, Alan Noell
Publisher:Bruce Crauder, Benny Evans, Alan Noell
Chapter5: A Survey Of Other Common Functions
Section5.3: Modeling Data With Power Functions
Problem 2E: Planetary Velocity The following table gives the mean velocity of planets in their orbits versus...
icon
Related questions
icon
Concept explainers
Topic Video
Question
A. An article in the Journal of Sound and Vibration described a study investigating the relationship
between noise exposure and hypertension. The data given in the table are representative of those
reported in the article.
Blood
ID
Noise Pressure
Blood
ID
Noise Pressure
(decibels)
Pressure
(decibels)
Pressure
65
11
4
83
1
63
12
4
90
2
65
13
7
90
3
3
71
14
8.
88
4
2.
75
15
4
88
4
81
16
95
1
80
17
8.
96
3
96
18
9.
92
8
5
85
19
7
100
1
80
20
6.
100
10
3
Solution:
1. Documentation: Excel output just like in PT 1 and 2.
2. Do these data provide sufficient evidence that there is a positive linear relationship between
the two variables?
3. What does R^2 imply?
Transcribed Image Text:A. An article in the Journal of Sound and Vibration described a study investigating the relationship between noise exposure and hypertension. The data given in the table are representative of those reported in the article. Blood ID Noise Pressure Blood ID Noise Pressure (decibels) Pressure (decibels) Pressure 65 11 4 83 1 63 12 4 90 2 65 13 7 90 3 3 71 14 8. 88 4 2. 75 15 4 88 4 81 16 95 1 80 17 8. 96 3 96 18 9. 92 8 5 85 19 7 100 1 80 20 6. 100 10 3 Solution: 1. Documentation: Excel output just like in PT 1 and 2. 2. Do these data provide sufficient evidence that there is a positive linear relationship between the two variables? 3. What does R^2 imply?
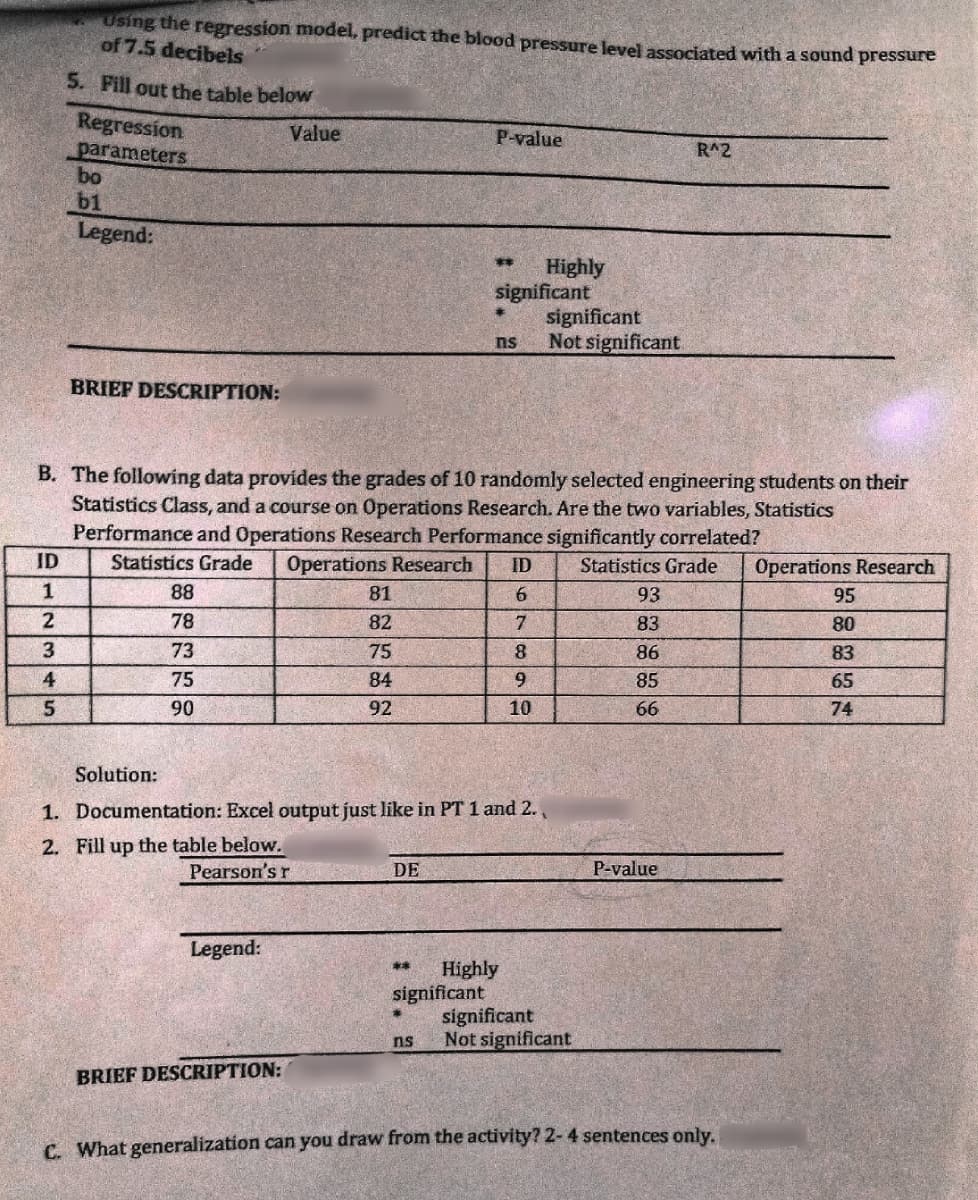
Using the regression model, predict the blood pressure level associated with a sound pressure
of 7.5 decibels
5. Fill out the table below
Regression
Value
P-value
parameters
bo
b1
Legend:
R^2
Highly
significant
significant
Not significant
*3
ns
BRIEF DESCRIPTION:
B. The followíng data provides the grades of 10 randomly selected engineering students on their
Statistics Class, and a course on Operations Research. Are the two variables, Statistics
Performance and Operations Research Performance significantly correlated?
Statistics Grade
ID
Operations Research
ID
Statistics Grade
Operations Research
88
81
6.
93
95
2
78
82
7.
83
80
73
75
8.
86
83
4
75
84
9
85
65
90
92
10
66
74
Solution:
1. Documentation: Excel output just like in PT 1 and 2.
2. Fill up the table below.
Pearson's r
DE
P-value
Legend:
Highly
significant
significant
Not significant
**
ns
BRIEF DESCRIPTION:
C. What generalization can you draw from the activity? 2- 4 sentences only.
Transcribed Image Text:Using the regression model, predict the blood pressure level associated with a sound pressure of 7.5 decibels 5. Fill out the table below Regression Value P-value parameters bo b1 Legend: R^2 Highly significant significant Not significant *3 ns BRIEF DESCRIPTION: B. The followíng data provides the grades of 10 randomly selected engineering students on their Statistics Class, and a course on Operations Research. Are the two variables, Statistics Performance and Operations Research Performance significantly correlated? Statistics Grade ID Operations Research ID Statistics Grade Operations Research 88 81 6. 93 95 2 78 82 7. 83 80 73 75 8. 86 83 4 75 84 9 85 65 90 92 10 66 74 Solution: 1. Documentation: Excel output just like in PT 1 and 2. 2. Fill up the table below. Pearson's r DE P-value Legend: Highly significant significant Not significant ** ns BRIEF DESCRIPTION: C. What generalization can you draw from the activity? 2- 4 sentences only.
Expert Solution
steps

Step by step

Solved in 4 steps with 1 images

Blurred answer
Knowledge Booster
Centre, Spread, and Shape of a Distribution
Learn more about
Need a deep-dive on the concept behind this application? Look no further. Learn more about this topic, statistics and related others by exploring similar questions and additional content below.
Similar questions
Recommended textbooks for you
Functions and Change: A Modeling Approach to Coll…
Algebra
ISBN:
9781337111348
Author:
Bruce Crauder, Benny Evans, Alan Noell
Publisher:
Cengage Learning
Mathematics For Machine Technology
Advanced Math
ISBN:
9781337798310
Author:
Peterson, John.
Publisher:
Cengage Learning,
Linear Algebra: A Modern Introduction
Algebra
ISBN:
9781285463247
Author:
David Poole
Publisher:
Cengage Learning