Using the appropriate model, sample size n, and output below: Model: y Bo + 1*₁ + B₂*₂ + ₂xy + Sample size: n=16 Regression Statistics Multiple R R Square Adjusted R Square. Standard Error Observations ANOVA Regression Residual Total Total variation Unexplained variation Explained variation R^2 R-bar 2 (1) Report the total variation, unexplained variation, and explained variation as shown on the output. (Round your answers to 4 decimal places.) 0.9981 0.9962 0.9953 381.8582 16 SSE 8^2 s DF SS 3 462,380,546.3200 12 1,749,788.0435 15 464,130,334.3635 (2) Report R² and R² as shown on the output. (Round your answers to 4 decimal places.) MS 154,126,848.7733 1,056.9978 145,815.6703 F(model) (3) Report SSE, 2, and s as shown on the output. Calculate a2 from SSE and other numbers. (Round your answers to 4 decimal places.) Significance F 0.0000 (4) Calculate the model) statistic by using the explained variation, the unexplained variation, and other relevant quantities. (Round your answer to 3 decimal places.) p-value ,000. (5) Use the Amodel) statistic and the appropriate rejection point to test the significance of the linear regression model under consideration by setting a equal to .05. HO: 81 82 830 by setting a = .05. (6) Find the p-value related to Amodel) on the output. Using the p-value, test the significance of the linear regression model by setting a 10, .05, .01, and .001. HO at a .05, .01, and .001.
Using the appropriate model, sample size n, and output below: Model: y Bo + 1*₁ + B₂*₂ + ₂xy + Sample size: n=16 Regression Statistics Multiple R R Square Adjusted R Square. Standard Error Observations ANOVA Regression Residual Total Total variation Unexplained variation Explained variation R^2 R-bar 2 (1) Report the total variation, unexplained variation, and explained variation as shown on the output. (Round your answers to 4 decimal places.) 0.9981 0.9962 0.9953 381.8582 16 SSE 8^2 s DF SS 3 462,380,546.3200 12 1,749,788.0435 15 464,130,334.3635 (2) Report R² and R² as shown on the output. (Round your answers to 4 decimal places.) MS 154,126,848.7733 1,056.9978 145,815.6703 F(model) (3) Report SSE, 2, and s as shown on the output. Calculate a2 from SSE and other numbers. (Round your answers to 4 decimal places.) Significance F 0.0000 (4) Calculate the model) statistic by using the explained variation, the unexplained variation, and other relevant quantities. (Round your answer to 3 decimal places.) p-value ,000. (5) Use the Amodel) statistic and the appropriate rejection point to test the significance of the linear regression model under consideration by setting a equal to .05. HO: 81 82 830 by setting a = .05. (6) Find the p-value related to Amodel) on the output. Using the p-value, test the significance of the linear regression model by setting a 10, .05, .01, and .001. HO at a .05, .01, and .001.

MATLAB: An Introduction with Applications
6th Edition
ISBN:9781119256830
Author:Amos Gilat
Publisher:Amos Gilat
Chapter1: Starting With Matlab
Section: Chapter Questions
Problem 1P

Related questions
Question
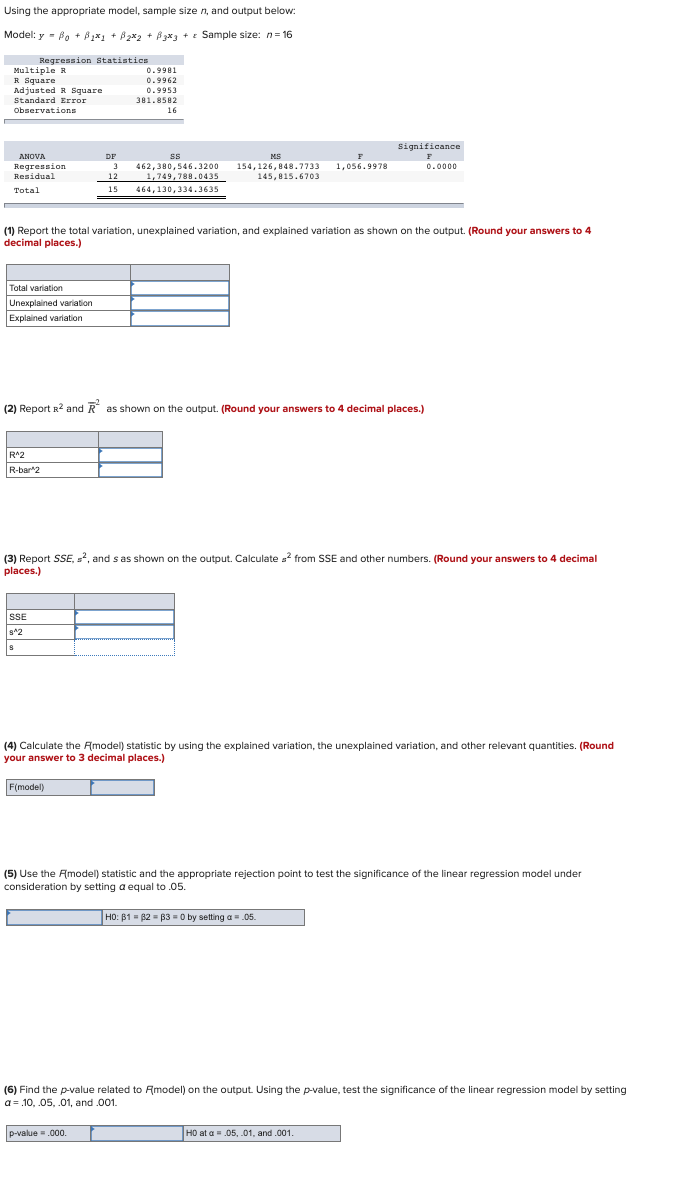
Transcribed Image Text:Using the appropriate model, sample size n, and output below:
Model: y = Bo + B₂*₁ + B₂x₂ + B3x3 + Sample size: n=16
Regression Statistics
Multiple R
R Square
Adjusted R Square
Standard Error
Observations
ANOVA
Regression
Residual
Total
Total variation
Unexplained variation
Explained variation
R^2
R-bar 2
(1) Report the total variation, unexplained variation, and explained variation as shown on the output. (Round your answers to 4
decimal places.)
0.9981
0.9962
0.9953
381.8582
16
SSE
8^2
DF
ss
3 462,380,546.3200
1,749,788.0435
12
15 464,130,334.3635
(2) Report R² and R² as shown on the output. (Round your answers to 4 decimal places.)
MS
F
154,126,848.7733 1,056.9978
145,815.6703
F(model)
(3) Report SSE, ², and s as shown on the output. Calculate s² from SSE and other numbers. (Round your answers to 4 decimal
places.)
Significance
F
0.0000
(4) Calculate the Amodel) statistic by using the explained variation, the unexplained variation, and other relevant quantities. (Round
your answer to 3 decimal places.)
p-value = .000.
(5) Use the Amodel) statistic and the appropriate rejection point to test the significance of the linear regre ion model under
consideration by setting a equal to .05.
HO: 81 82 83 = 0 by setting a = .05.
(6) Find the p-value related to Amodel) on the output. Using the p-value, test the significance of the linear regression model by setting
a= .10, .05, .01, and .001.
HO at a = .05, .01, and .001.
Expert Solution
This question has been solved!
Explore an expertly crafted, step-by-step solution for a thorough understanding of key concepts.

Step by step
Solved in 2 steps

Recommended textbooks for you
MATLAB: An Introduction with Applications
Statistics
ISBN:
9781119256830
Author:
Amos Gilat
Publisher:
John Wiley & Sons Inc

Probability and Statistics for Engineering and th…
Statistics
ISBN:
9781305251809
Author:
Jay L. Devore
Publisher:
Cengage Learning

Statistics for The Behavioral Sciences (MindTap C…
Statistics
ISBN:
9781305504912
Author:
Frederick J Gravetter, Larry B. Wallnau
Publisher:
Cengage Learning
MATLAB: An Introduction with Applications
Statistics
ISBN:
9781119256830
Author:
Amos Gilat
Publisher:
John Wiley & Sons Inc
Probability and Statistics for Engineering and th…
Statistics
ISBN:
9781305251809
Author:
Jay L. Devore
Publisher:
Cengage Learning
Statistics for The Behavioral Sciences (MindTap C…
Statistics
ISBN:
9781305504912
Author:
Frederick J Gravetter, Larry B. Wallnau
Publisher:
Cengage Learning

Elementary Statistics: Picturing the World (7th E…
Statistics
ISBN:
9780134683416
Author:
Ron Larson, Betsy Farber
Publisher:
PEARSON

The Basic Practice of Statistics
Statistics
ISBN:
9781319042578
Author:
David S. Moore, William I. Notz, Michael A. Fligner
Publisher:
W. H. Freeman

Introduction to the Practice of Statistics
Statistics
ISBN:
9781319013387
Author:
David S. Moore, George P. McCabe, Bruce A. Craig
Publisher:
W. H. Freeman