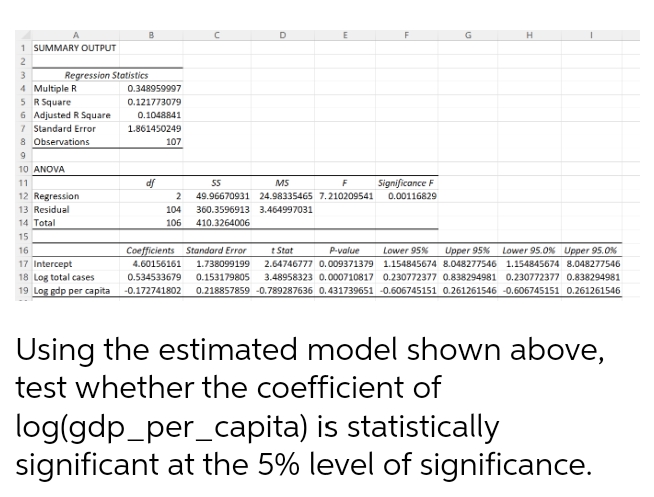
Using the estimated model shown above, test whether the coefficient of log(gdp_per_capita) is statistically significant at the 5% level of significance.


Q: 2. The sales, in millions of pesos, of a certain company are shown in the table below. Year X Sales…
A: Given data is Year(X) 1 2 3 4 5 6 7 8 9 10 Sales(Y) 12 15 17 18 16 19 21 20 22 24
Q: (6) 6. The following points are to be related by a power curve, y = axb a. Plot each point on the…
A: Given information: x y 0.14 340 1.1 750 4 9000 18 12000 40 42600 60 90000
Q: Find the (a) mean, (b) median, (c) mode, and (d) midrange for the data and then (e) answer the given…
A: Note: As per my policy i can answer only three sub parts. kindly repost the remaining sub parts.…
Q: For which of the following tasks can the best-fitting regression line be used? O for predicting the…
A: The question is about regression Regression : It is a statistical method use to determine the…
Q: The binomial distribution is used when there are exactly two mutally exclusive outcomes of a trial.…
A: The following information has been given: The probability of success is p=0.5. The probability of…
Q: using your graphs What generalizations can you make about how populations evolve in this simulation?…
A: Given information: Trial 1: y=0.0738x+12.154R2=0.957 Trial 2: y=0.0496x+1.3626R2=0.9682
Q: For the following: normal random variable with parameters μ = 0,0² = 1/2. 1. Compute the moment…
A: Given a normal random variable with parameters μ=0, σ2=12.
Q: Tables, Charts and Diagrams The coffee preferences of 100 people were recorded in a survey. Which…
A: Solution: The coffee preferences of 100 people were recorded in a survey.
Q: Problem #5
A: Anova is used to compare three or more groups when each groups are independent. Repeated anova used…
Q: question 21 an independent measures experiment with four treatment conditions has a sample of n=30…
A: Given that T1 = 14.5, T2 = 27.3, T3 = 24.5, T4 = 22.3 n=30
Q: Find the mean, median, and mode for the following data set. Round your answers to one decimal place,…
A:
Q: DO THIS TYPEWRITTEN AND WITH COMPLETE SOLUTIONS. NO UPVOTE FOR HANDWRITTEN. I WILL UPVOTE. DOWNVOTE…
A: The given data is Month Advertising Expense Sales Revenue April 10 180 May 14 170 June 12…
Q: You want to obtain a sample to estimate a population mean. Based on previous evidence, you believe…
A:
Q: A leading magazine (like Barron's) reported at one time that the average number of weeks an…
A:
Q: 1. Directions: Perform what is being asked. Write your answers on the spaces provided. 1. SJS…
A: Given data: Advertising expense 10 14 12 9 13 15 8 13 16 Sales Revenue 180 170 190 220 235 208…
Q: Problem 2 Let X be a discrete random variable with E(X²) = E(X)². Can the sample space only have two…
A: Given that X be a random variable such that E (X2) = [E (X)]2
Q: A financial analyst is examining the relationship between stock prices and earnings per share. She…
A: Regression equation are used to predict the future value over the another. It explains the…
Q: Assume that females have pulse rates that are normally distributed with a mean of μ = 73.0 beats per…
A:
Q: In the twentieth century, it was a common practice in Southern California for houses to be built…
A: From the provided information,
Q: leading magazine (like Barron's) reported at one time that the average number of weeks an individual…
A: Given data μ=24.6 σ=4.3 n = 71
Q: If it is known that the percentage of successful students is 75%, and you take a sample of 15…
A: Givenp=0.75n=15Let "x" be the no.of successful bears x~Binomial(n=15,p=0.75)P(X=x)=(nx)(p)x(1-p)n-x…
Q: Two distinct water samples were analyzed for cadmium (Cd) content and the results of 4 replicate…
A: Given data: Trial Cd in sample 1 Cd in sample 2 1 1.20 ppm 1.90 ppm 2 1.80 ppm 2.70 ppm 3…
Q: You wish to test the following claim at a significance level of α=0.05α=0.05.…
A: Given,H0:μ=85.7Ha:μ<85.7sample size(n)=5mean(x¯)=73.4standard deviation(s)=9.8and α=0.05
Q: The mean SAT score in mathematics is 513. The standard deviation of these scores is 49. A special…
A: The random variable SAT score follows normal distribution. We have to test whether the population…
Q: worms Frequency 1 4 2 3 3 2 4 5 6 7 2 3 32 2
A: Given data is Worms Frequency 1 4 2 3 3 2 4 4 5 2 6 3 7 2
Q: The skull measurement (in cm) of 20 full-term newborn male newborns is shown in the ranking data…
A: The following information has been provided:…
Q: Refer to the table below, the average number of chocolate chips per cookie in two competing…
A: The distributions of chocolate chips, that is obtained for the Brands A and B at the sample level…
Q: Each box of one brand of breakfast cereal contains a coupon entitling purchasers to a free package…
A: Introduction: It is required to use Excel to identify the best model that fits the data.
Q: The following are the word counts of a random sample of 20 articles with an average of 405.45. It…
A: Given that Sample size n =20 Sample mean =405.45 Population mean μ =570
Q: The binomial distribution is used when there are exactly two mutually exclusive outcomes of a trial.…
A: Suppose a random variable X, defines that the number of occurrence of heads.
Q: Draw a frequency polygon for the following: 2.5 7.5 3 5 Mid-Value of Class Interval: Frequency: 12.5…
A: Given that Mid-value of class Frequency 2.5 7.5 12.5 17.5 22.5 27.5 Frequency 3 5 10 15 7 5
Q: On Friday night, the owner of Chez Pierre in downtown Chicago noted the amount spent for dinner for…
A: Given that The data are X 95 ,103 ,109 , 170 ,114 ,113 ,107 ,124 ,105 ,80 , 104 ,84 ,176 ,115 ,69…
Q: Let X₁, X2, X3,..., X30 be a random sample of size 30 from a population distributed with the…
A: We need to find the lower bound for P(40 < Y < 80) by using Chebyshev's Inequality
Q: A consumer advocacy group is doing a large study on car rental practices. Among other things, the…
A: Sample is the subset of population. For the larger population, the margin of error is known then…
Q: ngineers must consider the diameters of heads when designing helmets. The company researchers have…
A: Concept: Z score=(X-mean)/standard deviation
Q: a) Your Communications division manufactures wireless dongles for use in general computing. These…
A: There are two measures used to summarize the data set. They are measure of central tendency and…
Q: A simple random sample of 8 employees of a corporation provided the following information. Employee…
A: A simple random sample of 8 employees of a corporation provided the given Information. The objective…
Q: Suppose that the heights of adult men in the United States are normally distributed with a mean of…
A: Given: Let X be the height of adults in united states follow normal distribution X~N(u=69.5, σ= 3.5)…
Q: You wish to test the following claim at a significance level of α=0.001α=0.001. Ho:μ1=μ2…
A: There are two independent samples which follows normal distribution. We have to test whether the…
Q: For effect sizes, which one does not measure the proportion of variance accounted for (i.e.…
A: The objective is to identify the option, which does not measure the proportion of explained…
Q: If n=190 and p' (p-prime) = 0.71, construct a 90% confidence interval. Give your answers to three…
A: Given: n=190p'=0.71Confidence level=90%=0.90
Q: 99.5% confidence interval, for μ1−μ2 given the following information. n1=25, ¯x1=2.4 s1=0.79 n2=45,…
A: given data n1=25n2=45x1¯ = 2.4x2¯ = 2.9s1=0.79s2=0.33confidence interval = 0.995α = 1-0.995=0.005
Q: P(Z<1.89) (less than or equal to)
A: Given that. X~N( 0 , 1 ) μ=0 , ?=1 (for standard normal distribution) Z-score =( x - μ )/?
Q: You are conducting a multinomial hypothesis test for the claim that the 4 categories occur with the…
A: There is only one categorical variable has 4 categories. The proportional values and observed…
Q: A psychologist is interested in constructing a 99% confidence interval for the proportion of people…
A:
Q: You wish to test the following claim (Ha) at a significance level of a = 0.001. For the context of…
A: The question is about paired t test Given : Null and alt. hypo : H0 : μd = 0Ha : μd ≠ 0 Level of…
Q: 1.11 A quick survey gives the price—an estimated average for a 170-gram can—for 14 different brands…
A: The data shows the 14 different brands of water-packed light tuna, based on prices paid nationality…
Q: 2. Find the median and mode of the following data: Trees 1 2 3 4 5 6 Frequency 2 5 6 4 1 8
A: Median and Mode: The mid element in a classified array of numbers is termed the median. By arranging…
Q: QUESTION 7 A researcher has estimated a linear model to study the effect of weekly household income…
A: Slope is the measure of regression equation. It is the changing variable in the regression equation.…
Q: a. Compute the population mean. b. Compute the population standard deviation.
A: Given: Set of data x: 15,2,1,3,10,9,9,10,9,8 To find population mean and population standard…
5

Step by step
Solved in 2 steps

- Lyme disease is an inflammatory disease that results in a skin rash and flulike symptoms. It is transmitted through the bite of an infected deer tick. The following data represent the number of reported cases of Lyme disease and the number of drowning deaths for a rural county. Cases_of_Lyme_Disease Drowning_Deaths Month3 0 J2 1 F2 2 M4 1 A5 3 M15 9 J22 17 J13 5 A6 3…0.6.3 Question 3 Is the cubic effect significant? How about quadratic and linear effects? Analysis of Variance Table Response: EX Df Sum Sq Mean Sq F value Pr(>F) MET 1 332 332 0.1246 0.7257742 I(MET^2) 1 37504 37504 14.0572 0.0005141 *** I(MET^3) 1 7245 7245 2.7154 0.1065086 Residuals 44 117390 2668 > anova(quadModel) Analysis of Variance Table Response: EX Df Sum Sq Mean Sq F value Pr(>F) MET 1 332 332 0.120 0.7306134 I(MET^2) 1 37504 37504 13.541 0.0006216 *** Residuals 45 124635 2770 --- Signif. codes: 0 ‘***’ 0.001 ‘**’ 0.01 ‘*’ 0.05 ‘.’ 0.1 ‘ ’ 1A multiple regression analysis produced the following tables. Summary Output Regression Statistics Multiple R 0.978724022 R Square 0.957900711 Adjusted R Square 0.952287472 Standard Error 67.67055418 Observations 18 ANOVA df SS MS F Significance F Regression 2 1562918.941 781459.5 170.6503 4.80907E-11 Residual 15 68689.55855 4579.304 Total 17 1631608.5 Coefficients Standard Error t Stat P-value Intercept 1959.709718 306.4905312 6.39403 1.21E-05 X1 -0.469657287 0.264557168 -1.77526 0.096144 X2 -2.163344882 0.278361425 -7.77171 1.23E-06 For x1= 360 and x2 = 220, the…
- A multiple regression analysis produced the following tables. Summary Output Regression Statistics Multiple R 0.978724022 R Square 0.957900711 Adjusted R Square 0.952287472 Standard Error 67.67055418 Observations 18 ANOVA df SS MS F Significance F Regression 2 1562918.941 781459.5 170.6503 4.80907E-11 Residual 15 68689.55855 4579.304 Total 17 1631608.5 Coefficients Standard Error t Stat P-value Intercept 1959.709718 306.4905312 6.39403 1.21E-05 X1 -0.469657287 0.264557168 -1.77526 0.096144 X2 -2.163344882 0.278361425 -7.77171 1.23E-06 These results indicate that…A multiple regression analysis produced the following tables. Summary Output Regression Statistics Multiple R 0.978724022 R Square 0.957900711 Adjusted R Square 0.952287472 Standard Error 67.67055418 Observations 18 ANOVA df SS MS F Significance F Regression 2 1562918.941 781459.5 170.6503 4.80907E-11 Residual 15 68689.55855 4579.304 Total 17 1631608.5 Coefficients Standard Error t Stat P-value Intercept 1959.709718 306.4905312 6.39403 1.21E-05 X1 -0.469657287 0.264557168 -1.77526 0.096144 X2 -2.163344882 0.278361425 -7.77171 1.23E-06 Using α = 0.01 to test the…A multiple regression analysis produced the following tables. Summary Output Regression Statistics Multiple R 0.978724022 R Square 0.957900711 Adjusted R Square 0.952287472 Standard Error 67.67055418 Observations 18 ANOVA df SS MS F Significance F Regression 2 1562918.941 781459.5 170.6503 4.80907E-11 Residual 15 68689.55855 4579.304 Total 17 1631608.5 Coefficients Standard Error t Stat P-value Intercept 1959.709718 306.4905312 6.39403 1.21E-05 X1 -0.469657287 0.264557168 -1.77526 0.096144 X2 -2.163344882 0.278361425 -7.77171 1.23E-06 The regression equation for…
- A multiple regression analysis produced the following tables. Summary Output Regression Statistics Multiple R 0.978724022 R Square 0.957900711 Adjusted R Square 0.952287472 Standard Error 67.67055418 Observations 18 ANOVA df SS MS F Significance F Regression 2 1562918.941 781459.5 170.6503 4.80907E-11 Residual 15 68689.55855 4579.304 Total 17 1631608.5 Coefficients Standard Error t Stat P-value Intercept 1959.709718 306.4905312 6.39403 1.21E-05 X1 -0.469657287 0.264557168 -1.77526 0.096144 X2 -2.163344882 0.278361425 -7.77171 1.23E-06 Using α = 0.01 to test the…A new vaccination is being used in a laboratory experiment to investigate whether it is effective. There are 273273 subjects in the study. Is there sufficient evidence to determine if vaccination and disease status are related? Vaccination Status Diseased Not Diseased Total Vaccinated 5757 6262 119119 Not Vaccinated 8383 7171 154154 Total 140140 133133 273273 Copy Data Step 6 of 8 : Find the critical value of the test at the 0.0050.005 level of significance. Round your answer to three decimal places.Consider the following model that relates the percentage of a household’s budget spent on milk MK to total expenditure TOTEXP, age of the household head AGE, and the number of children in the household NK. MK = ?1 + ?2ln(??????)+ ?3??+ ?4???+? This model was estimated using 1400 observations from Bahrain. An incomplete version of this output is provided in the following table. Regressor Coefficient Standard Error T-Ratio C 1.4515 2.2019 0.212 ln(??????) 2.7648 0.4842 2.206 ?? -1.4541 0.6395 -0.2141 ??? -0.1503 0.0235 -5.5214 Instructions: Interpret each of the estimates ?2 ,?3 ??? ?4
- An educational researcher wishes to know if there is a difference in academic performance for college freshmen that live on campus and those that commute. Data was collected from 275 students. Can we conclude that freshman housing location and academic performance are related? Location Average Below Average Above Average Total On campus 100 57 58 215 Off campus 30 17 13 60 Total 130 74 71 275 Copy Data Step 6 of 8 : Find the critical value of the test at the 0.05level of significance. Round your answer to three decimal places. Step 7 of 8: Make decision to reject or fail to reject/ is there enough evidence Step 8 of 8: State the conclusion of the hypothesis test at the 0.05 level of significanceObserved Data: 21 smooth/yellow 42 smooth/light-yellow 19 smooth/white 22 wrinkled/yellow 39 wrinkled/light-yellow 20 wrinkled/white Please fill in the table Chi Squared problems: E=expected O=Observed Phenotype Observed Expected O-E (O-E)2 (O-E)2/EA statistical program is recommended. The owner of Showtime Movie Theaters, Inc., would like to predict weekly gross revenue as a function of advertising expenditures. Historical data for a sample of eight weeks follow. WeeklyGrossRevenue($1,000s) TelevisionAdvertising($1,000s) NewspaperAdvertising($1,000s) 96 5.0 1.5 90 2.0 2.0 95 4.0 1.5 92 2.5 2.5 95 3.0 3.3 94 3.5 2.3 94 2.5 4.2 94 3.0 2.5 (a) Develop an estimated regression equation with the amount of television advertising as the independent variable. (Round your numerical values to two decimal places. Let x1 represent the amount of television advertising in $1,000s and y represent the weekly gross revenue in $1,000s.) ŷ = ?? (b) Develop an estimated regression equation with both television advertising and newspaper advertising as the independent variables. (Round your numerical values to two decimal places. Let x1 represent the amount of television advertising in $1,000s, x2 represent the amount of…


