Using the information of production and consumption of masks in the U.S. on Table 1 on page 5, compute a quantity of masks traded at each of seven relative prices of masks. Fill your answers in the sixth column on the table. [You do not need to show your computation works.] Using the information of production and consumption of masks in China on Table 2 on page 5, compute a quantity of masks traded at each of seven relative prices of masks. Fill your answers in the sixth column on the table. [You do not need to show your computation works.] Note: A quantity of masks traded is an excess demand (shortage) or an excess supply (surplus) of masks at each relative price of masks. All quantities traded (either imports or exports) should be positive numbers. Draw the import-demand curve of masks of the U.S. (mark as MDUS) and the export-supply curve of masks of China (mark as XSChins) on the same diagram. Note: On the diagram of import-demand and export-supply of masks, the vertical axis measures a relative price of masks and the horizontal axis measures quantities of masks traded. Make sure to plot seven points first, then connect them by smooth curved line for each country. Indicate an equilibrium on the diagram (mark as E). How much is an equilibrium relative price of masks traded in the world? How much is an equilibrium quantity of masks traded in the world? Note: Your diagram should look like Figure 9-3 on page 218 in "Chapter 9: The Instruments of Trade Policy" of your tetbook
Using the information of production and consumption of masks in the U.S. on Table 1 on page 5, compute a quantity of masks traded at each of seven relative prices of masks. Fill your answers in the sixth column on the table. [You do not need to show your computation works.] Using the information of production and consumption of masks in China on Table 2 on page 5, compute a quantity of masks traded at each of seven relative prices of masks. Fill your answers in the sixth column on the table. [You do not need to show your computation works.] Note: A quantity of masks traded is an excess demand (shortage) or an excess supply (surplus) of masks at each relative price of masks. All quantities traded (either imports or exports) should be positive numbers. Draw the import-demand curve of masks of the U.S. (mark as MDUS) and the export-supply curve of masks of China (mark as XSChins) on the same diagram. Note: On the diagram of import-demand and export-supply of masks, the vertical axis measures a relative price of masks and the horizontal axis measures quantities of masks traded. Make sure to plot seven points first, then connect them by smooth curved line for each country. Indicate an equilibrium on the diagram (mark as E). How much is an equilibrium relative price of masks traded in the world? How much is an equilibrium quantity of masks traded in the world? Note: Your diagram should look like Figure 9-3 on page 218 in "Chapter 9: The Instruments of Trade Policy" of your tetbook

Brief Principles of Macroeconomics (MindTap Course List)
8th Edition
ISBN:9781337091985
Author:N. Gregory Mankiw
Publisher:N. Gregory Mankiw
Chapter3: Interdependence And The Gains Rrom Trade
Section: Chapter Questions
Problem 6PA

Related questions
Question
5
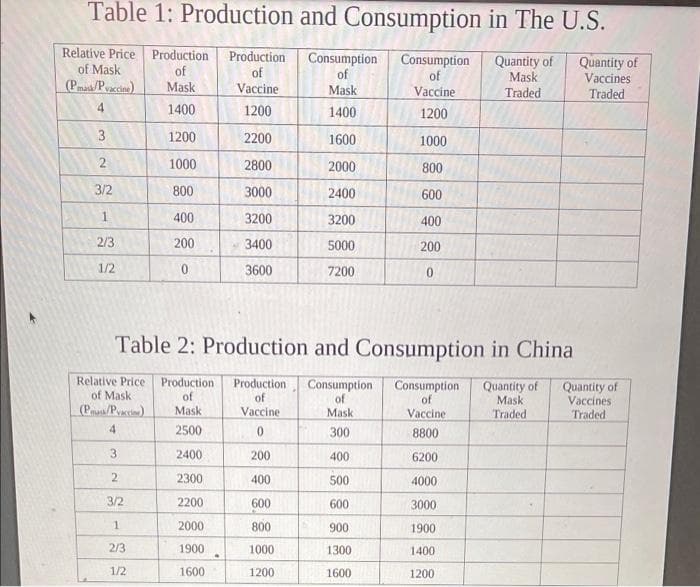
Transcribed Image Text:Table 1: Production and Consumption in The U.S.
Relative Price Production
of Mask
(Pma/Pyccine)
Production
Consumption
Consumption
Quantity of
Mask
Traded
Quantity of
Vaccines
of
of
of
of
Mask
Vaccine
Mask
Vaccine
Traded
4
1400
1200
1400
1200
3.
1200
2200
1600
1000
1000
2800
2000
800
3/2
800
3000
2400
600
400
3200
3200
400
2/3
200
3400
5000
200
1/2
3600
7200
Table 2: Production and Consumption in China
Relative Price
of Mask
(P/Pei)
Production
Consumption
of
Quantity of
Mask
Traded
Production
Consumption
of
Mask
Quantity of
Vaccines
Traded
of
of
Mask
Vaccine
Vaccine
2500
300
8800
3.
2400
200
400
6200
2300
400
500
4000
3/2
2200
600
600
3000
1
2000
800
900
1900
2/3
1900
1000
1300
1400
1/2
1600
1200
1600
1200
4.
2.
![a. Partial Equilibrium i
Using the information of production and consumption of masks in the U.S. on Table 1 on page 5,
compute a quantity of masks traded at each of seven relative prices of masks. Fill your answers in the
sixth column on the table. [You do not need to show your computation works.]
Using the information of production and consumption of masks in China on Table 2 on page 5,
compute a quantity of masks traded at each of seven relative prices of masks. Fill your answers in the
sixth column on the table. [You do not need to show your computation works.]
Note: A quantity of masks traded is an excess demand (shortage) or an excess supply (surplus) of
masks at each relative price of masks. All quantities traded (either imports or exports) should be
positive numbers.
Draw the import-demand curve of masks of the U.S. (mark as MDus) and the export-supply curve of
masks of China (mark as XSChias) on the same diagram.
Note: On the diagram of import-demand and export-supply of masks, the vertical axis measures a
relative price of masks and the horizontal axis measures quantities of masks traded. Make sure to
plot seven points first, then connect them by smooth curved line for each country.
Indicate an equilibrium on the diagram (mark as E). How much is an equilibrium relative price of
masks traded in the world? How much iş an equilibrium quantity of masks traded in the world?
Note: Your diagram should look like Figure 9-3 on page 218 in "Chapter 9: The Instruments of
Trade Policy" of your textbook.](/v2/_next/image?url=https%3A%2F%2Fcontent.bartleby.com%2Fqna-images%2Fquestion%2F3f74577e-d171-4c08-90b0-30e1c38728db%2F7701c40e-bcfa-4273-8de1-bdf0b4a8a66b%2Fn6jblmk_processed.jpeg&w=3840&q=75)
Transcribed Image Text:a. Partial Equilibrium i
Using the information of production and consumption of masks in the U.S. on Table 1 on page 5,
compute a quantity of masks traded at each of seven relative prices of masks. Fill your answers in the
sixth column on the table. [You do not need to show your computation works.]
Using the information of production and consumption of masks in China on Table 2 on page 5,
compute a quantity of masks traded at each of seven relative prices of masks. Fill your answers in the
sixth column on the table. [You do not need to show your computation works.]
Note: A quantity of masks traded is an excess demand (shortage) or an excess supply (surplus) of
masks at each relative price of masks. All quantities traded (either imports or exports) should be
positive numbers.
Draw the import-demand curve of masks of the U.S. (mark as MDus) and the export-supply curve of
masks of China (mark as XSChias) on the same diagram.
Note: On the diagram of import-demand and export-supply of masks, the vertical axis measures a
relative price of masks and the horizontal axis measures quantities of masks traded. Make sure to
plot seven points first, then connect them by smooth curved line for each country.
Indicate an equilibrium on the diagram (mark as E). How much is an equilibrium relative price of
masks traded in the world? How much iş an equilibrium quantity of masks traded in the world?
Note: Your diagram should look like Figure 9-3 on page 218 in "Chapter 9: The Instruments of
Trade Policy" of your textbook.
Expert Solution
This question has been solved!
Explore an expertly crafted, step-by-step solution for a thorough understanding of key concepts.

Step by step
Solved in 2 steps with 6 images

Knowledge Booster


Learn more about
Need a deep-dive on the concept behind this application? Look no further. Learn more about this topic, economics and related others by exploring similar questions and additional content below.Recommended textbooks for you
Brief Principles of Macroeconomics (MindTap Cours…
Economics
ISBN:
9781337091985
Author:
N. Gregory Mankiw
Publisher:
Cengage Learning

Principles of Economics 2e
Economics
ISBN:
9781947172364
Author:
Steven A. Greenlaw; David Shapiro
Publisher:
OpenStax
Brief Principles of Macroeconomics (MindTap Cours…
Economics
ISBN:
9781337091985
Author:
N. Gregory Mankiw
Publisher:
Cengage Learning
Principles of Economics 2e
Economics
ISBN:
9781947172364
Author:
Steven A. Greenlaw; David Shapiro
Publisher:
OpenStax