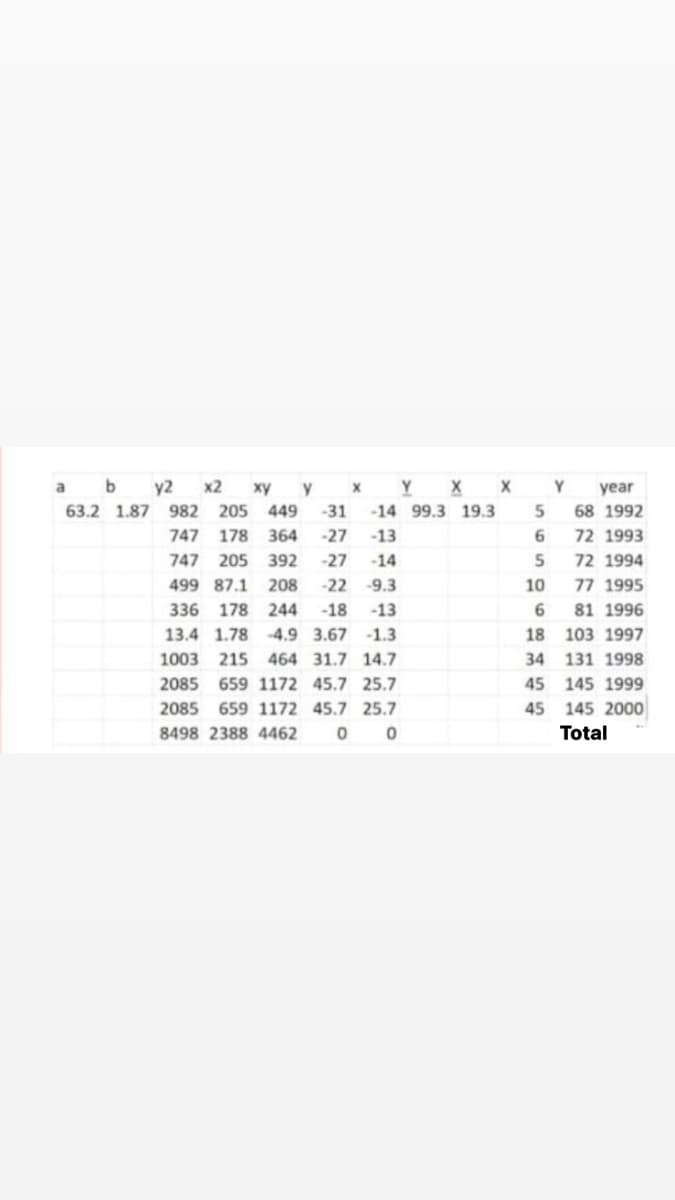
variance and standard deviation of the estimated parameters alpha and beta


Q: Give at examples at least two pairs of data that will most likely yield different variance and…
A: Mean =∑iXinVariance =∑i(Xi-X)2NStandard Deviation = Variance
Q: Find the valance of the ages.
A: The variance of X is defined as Var(X) = E(X2) - (E(X))2
Q: The homogeneity of variance assumption requires that: A. the sample variance is equal to the…
A: The assumption of homogeneity of variance is that the variance within each of the populations is…
Q: (a) Give an estimate of this common population variance by pooling the sample variances given. (b)…
A:
Q: table below, the average number of chocolate ch products. Assume the population of the number of…
A: Given: For Brand A Sample meanx¯1=6.4Sample size(n1)=10Sample stanard deviation(s1)=1.1 For Brand B…
Q: 4,9,6,4,11,14 (b) Use the Alternate Formula for Sample Variance to find the variance and standard…
A: Formula : Sample variance : s2=∑x2-∑x2nn-1 Sample standard deviation : s =s2
Q: In a randomized study, the following scores are obtained per group. Test the ascension of…
A: Denote μ1,μ2,μ3, µ as the mean scores among the three treatment groups 1, 2, 3, and 4 respectively.…
Q: Chi-Square tests are performed using Select one: O a. variances O b. quantiles Oc. covariances O d.…
A:
Q: A. Find the range. B. Find the standard deviation. C. Find the variance.
A: Given: Bar strength Number of bars, f 240-269 22 270-299 17 300-329 4 330-359 11…
Q: Find the means, variances and covariance of Y, and Y
A:
Q: Find the M.L.E for the population mean in poission distribution and also find variance.....
A:
Q: A researcher wants to know if male and female college students differ with regard to their GPAs. She…
A:
Q: Find the variance and standard deviation of the rv X from Exercise 3.1.
A: Given : Number of slots = 38 Number of black slots = 18 Number of red slots = 18 Number of green…
Q: a) the mean D) The variance
A: Since , the probability density function is , = 0 ; otherwise Our aim is to find the mean and…
Q: B. In the procedure of computing the Variance of a distribution, we squared the deviations. What is…
A: B. While computing the variance of a distribution, we square the deviations and divide it with count…
Q: A) create the frequency table. B) Calculate the variance value.
A: Given data is appropriate for measures of central tendency to find the central value for the Given…
Q: You believe that there is a 40 percent chance that stock A will decline by 10 percent and a 60…
A: There are two stock : Stock A & Stock B The above data can be summarizes into table form as…
Q: A random sample of 21 waiting times (in minutes) before patients saw a medical professional in a…
A: We have to perform f test for testing that if one variance is more than other.
Q: A researcher wants to know if male and female college students differ with regard to their GPAs. She…
A:
Q: the data show the traveler spending in billions for a recent year for a sample of the states find…
A: Measure of central tendency measures the central or average value of a dataset. Measured of…
Q: Participants in a psychology program have normally distributed IQ scores, with a mean of 104 and a…
A: We want to find IQ score
Q: What is the variance of the time it takes to change the oil? Keep two digits after the period. So,…
A: Given: Mean μ = 5 minutes. Formula used: Exponential distribution: X~Exp(λ) λ = 1μ Variance σ2 = 1λ2…
Q: g. Determine the variance of X². h. Determine the variance of Y².
A:
Q: The data below shows the overall miles per gallon (mpg) of 2021 small SUVs. What is the variance?…
A: Given data is24,23,22,21,22,22,18,18,26,26,26,19,19,19,21,21,21,21,21,18,19,21,22,22,16,16
Q: Find the mean and variance of
A: Given that fx=ke-2x,x>0 The value of k is calculated below: ∫0∞f(x)dx=1∫0∞ke-2xdx=1ke-2x-20∞=1…
Q: The grouped data in Table below represent the number of children from birth through the end of the…
A: Given data is grouped data with class and class frequencies. Data is: Class 0-3 4-7 8-11…
Q: When a model (equation/s) is based on experimental data, and is not developed directly from…
A: We know Empirical models are the ones which are based on experiment and obsevatiosns Therefore,…
Q: Q/Find the standard deviation and variance for the following data: Cat. 50-80 Frequency 80-100 5…
A:
Q: e table below, find the variance ans the standard deviation of the retur Probability Return (%) 0.2…
A: The mean is calculated as: μ=∑x·p(x)=2×0.2+6×0.5+8×0.3=5.8
Q: (c) Find the variance and standard deviation. Round the variance to two decimal places and standard…
A: Given data: Probability = p = 0.1 Sample size (n) = 8
Q: 1, 5, 6, 9, 12, 12, 15, 23, 55 transfrom the data using yi=-2x+6. calcualte the mean, variance, and…
A: Let, the given values are x . x = 1, 5, 6, 9, 12, 12, 15, 23, 55 Substitute each value in the…
Q: classes 10- 20- 30- 40- 50-60 frequency 4 Q11:For above distribution table find the variance and the…
A:
Q: X 1 2 3 4 5 6 P(x) 0.09 0.14 0.22 0.20 0.17 0.18
A:
Q: variance, standard deviation and coefficient of variation.
A: Here use formula of standard deviation and mean
Q: What does this formula compute? E (Y-Y')² N Oest Select one: O a. Variance of Y O b. Variance of the…
A: Given Information: Formula: σest=∑iY-Y'2N (a), (b) are the variances of Y and slope. Variance…
Q: Consider an experiment in which a coin is tossed thrice. Let X be the number of heads. Find the…
A:
Q: Actuaries use various parameters when evaluating the cost of a life insurance policy. The variance…
A: I have attached the solution and code:
Q: Radon is a gas emitted from the ground that can collect in houses in buildings. At certain levels it…
A: variance=∑(x-x¯)2nstandard deviation=∑(x-x¯)2nlet us find x¯=sum of all obervationsn=22.46=3.733…
Q: 5. A researcher wishes to determine the number of cups of coffee a customer drinks with an evening…
A:
Q: like to swim fast, but swimming c ty's swim team found a variance at a different university found th…
A: Let X1 be the random variable such that swimming times by men on a local university’s swim team.…
Q: a) the mean b) The variance
A:
Q: VIF is a measure of how much the variance of the estimated regression coefficients are inflated.
A: Here use definition of variance inflation factors
Q: What provides a measure of the variance caused by random, unsystematic differences? a. the error…
A: What provides a measure of the variance caused by random, unsystematic differences? a. the…
Q: Actuaries use various parameters when evaluating the cost of a life insurance policy. The variance…
A: n1=n2 =30 dfn =n1-1 dfd=n2-1
Q: Actuaries use various parameters when evaluating the cost of a life insurance policy. The variance…
A: The table shows the current year and last year summarized values.
Q: Assume that we have a data set composed of three features. After doing PCA we find that the…
A: PCA.
Q: The mean square error is the variance plus the bias. True O False
A: we have to find given statement is true or false.
Q: Variance - the measure of dispersion that accounts for the average squared deviation of each…
A: Formula for variance is , σ2=∑xi-x¯2N Where, x¯ is sample mean x¯=∑ xiN
Q: Find the variance.
A: Given is a sample of 40 data points as shown below:

Step by step
Solved in 2 steps with 1 images

- Repeat Example 5 when microphone A receives the sound 4 seconds before microphone B.y x1 x2 x3 x40.8 44711 739 586 7.41.6 27896 690 526 12.51.5 25435 728 566 29.61.4 31889 549 338 22.61.1 37503 931 825 19.61.4 32822 678 506 7.81.9 22833 923 820 10.70.9 36000 822 677 33.71.6 23497 405 146 23.31.7 25285 678 506 13.5part C D 33000331 UPH-1 St. Lawrence dolomite 618 0.05 2.69 2.74 2.83 48000168 Langer Platteville dolomite 127.8 0.06 2.69 2.75 2.86 52000415 3-21-13z1 Galena dolomite 575 0.04 2.72 2.76 2.83 52000415 3-21-13z1 Platteville dolomite 740 0.05 2.7 2.75 2.85 60000086 VD #1 Silurian dolomite 684 0.03 2.75 2.78 2.83 60000086 VD #1 Galena dolomite 1070 0.05 2.69 2.74 2.84 60000086 VD #1 Platteville dolomite 1142 0.02 2.77 2.79 2.83 13001466 NS-2 Tunnel City sandstone 60.1 0.14 2.41 2.54 2.79 13001466 NS-2 Tunnel City sandstone 60.2 0.28 1.93 2.21 2.67 13001466 NS-2 Tunnel City sandstone 118.3 0.3 1.88 2.18 2.7 33000331 UPH-1 St. Peter sandstone 222 0.22 2.06 2.28 2.65 33000331 UPH-1 Jordan sandstone 531 0.21 2.09 2.3 2.65 33000331 UPH-1 Tunnel City sandstone 644 0.18 2.22 2.4 2.7 33000331 UPH-1 Wonewoc sandstone 735 0.2 2.12 2.32 2.65 33000331 UPH-1 Wonewoc sandstone 840 0.27 1.93 2.2 2.66 33000331 UPH-1 Mt. Simon sandstone 927 0.18 2.31 2.49 2.81…
- Resistors labeled as 100 Ω are purchased from two different vendors. The specification for this type of resistor is that its actual resistance be within 5% of its labeled resistance. In a sample of 180 resistors from vendor A, 149 of them met the specification. In a sample of 270 resistors purchased from vendor B, 233 of them met the specification. Vendor A is the current supplier, but if the data demonstrate convincingly that a greater proportion of the resistors from vendor B meet the specification, a change will be made. P-value?Resistors labeled as 100 Ω are purchased from two different vendors. The specification for this type of resistor is that its actual resistance be within 5% of its labeled resistance. In a sample of 180 resistors from vendor A, 150 of them met the specification. In a sample of 270 resistors purchased from vendor B, 233 of them met the specification. Vendor A is the current supplier, but if the data demonstrate convincingly that a greater proportion of the resistors from vendor B meet the specification, a change will be made. a) State the appropriate null and alternate hypotheses. b) Find the P-value. c) Should a change be made?Date Ford stock Price y Japanese Yen x1 Deutsche Mark x2 S&P500 x3 1992.1 38.3 133.2 1.64 407.36 1992.2 45.2 125.5 1.53 408.21 1992.3 39.4 119.2 1.41 418.48 1992.4 42.7 124.7 1.61 435.64 1993.1 52.3 121.3 1.61 450.16 1993.2 55.3 110.1 1.69 447.29 1993.3 64.7 105.2 1.62 459.24 1993.4 58.1 111.3 1.73 465.34 1994.1 59.9 103.4 1.76 463.21 1994.2 27.6 99.5 1.6 454.83 1994.3 27.5 98.5 1.55 466.96 1994.4 26.3 99.6 1.38 455.19 1995.1 29.5 89.4 1.39 493.15 1995.2 31.2 84.6 1.42 539.23 1995.3 28.7 98.2 1.43 578.32 1995.4 28.9 102.4 1.48 614.57 1996.1 34.8 106.3 1.52 647.05 1996.2 36.2 109.8 1.58 668.53 1996.3 32.1 110.5 1.61 672.92 1996.4 33.9 112.8 1.69 689.35
- It might be predicted that consumer buying behavior would vary with the location of products in a store. Therefore, a team of market researchers looked at the sales per day for a known and unknown brand of candy bars. Additionally, the researchers placed the candy bars in the usual location and next to the cash register in different stores. What can the market researchers conclude with an α of 0.01? known brand known brand unknown brand unknown brand usual register usual register 1624191773018 25151620312719 11691314711 19181621221719 A) Obtain/compute the appropriate values to make a decision about H0. Location: critical value = test statistic = Decision: Brand: critical value = test statistic = Decision: Interaction: critical value = test statistic = Decision: B) Compute the corresponding effect size(s) and indicate magnitude(s).Location: η2 = Brand: η2 = Interaction: η2 = C) Make an interpretation based on the results.…No. Emp. No. Prod. Wkrs. Value Added by Mfg. Cost of Materials Value of Indus. Shipmnts New Cap. Exp. End Yr. Inven. Indus. Grp. 433 370 23518 78713 4 1833 3630 1 131 83 15724 42774 4 1056 3157 1 204 169 24506 27222 4 1405 8732 1 100 70 21667 37040 4 1912 3407 1 220 137 20712 12030 4 1006 1155 1 89 69 12640 13674 3 873 3613 1 26 18 4258 19130 3 487 1946 1 143 72 35210 33521 4 2011 7199 1 171 126 20548 19612 4 1135 3135 1 21 15 23442 5557 3 605 5506 2 3 2 287 163 1 2 42 2 2 2 1508 314 1 15 155 2 6 4 624 2622 1 27 554 2 52 47 2471 4219 2 292 929 3 74 63 4307 5357 2 454 1427 3 13 12 673 1061 1 20 325 3 17 13 817 707 1 84 267 3 169 147 8986 10421 3 534 2083 3 51 41 3145 4140 2 220 697 3 55 44 4076 7125 2 176 1446 3 84 76 3806 8994 2 423 1014 3 61 47 4276 5504 2 464 1291 3 27 22 1239 716 1 22 356 4 200 178 9423 8926 3 200 2314 4 294 250 11045 11121 3 189 2727 4 38 32 1916 2283 1 29 682 4 17 14 599 364 1 21 197 4 34 28 2063 1813 1 20…2.62 For the period 2001–2008, the Bristol-Myers Squibb Company, Inc. reported the following amounts (in billions of dollars) for (1) net sales and (2) advertising and product promotion. The data are also in the file XR02062. Source: Bristol-Myers Squibb Company, Annual Reports, 2005, 2008. Year Net Sales Advertising/Promotion 2001 $16.612 $1.201 2002 16.208 1.143 2003 18.653 1.416 2004 19.380 1.411 2005 19.207 1.476 2006 16.208 1.304 2007 18.193 1.415 2008 20.597 1.550 For these data, construct a line graph that shows both net sales and expenditures for advertising/product promotion over time. Some would suggest that increases in advertising should be accompanied by increases in sales. Does your line graph support this?
- PercentUnder 21 Fatal Accidentsper 1000 13 2.962 12 0.708 8 0.885 12 1.652 11 2.091 17 2.627 18 3.83 8 0.368 13 1.142 8 0.645 9 1.028 16 2.801 12 1.405 9 1.433 10 0.039 9 0.338 11 1.849 12 2.246 14 2.855 14 2.352 11 1.294 17 4.1 8 2.19 16 3.623 15 2.623 9 0.835 8 0.82 14 2.89 8 1.267 15 3.224 10 1.014 10 0.493 14 1.443 18 3.614 10 1.926 14 1.643 16 2.943 12 1.913 15 2.814 13 2.634 9 0.926 17 3.256 D. Give a 95% interval estimate of the number of fatal accidents per 1000 licenses ina city where 15% of the licensed drivers are under 21Assume that σ12 = σ22 = σ2. Calculate the pooled estimator of σ2 for s12=50, s22=57 and n1 =n2 =18.Interva l Class Mid f cf≤ cf≥ f.m Frequency% fm2 45≤50 47.5 3 3 29 142.5 10.34 6768.75 50≤55 52.5 7 10 26 367.5 24.14 19293.75 55≤60 57.5 4 14 19 230 13.79 13225 60≤65 62.5 5 19 15 312.5 17.24 19531.25 65≤70 67.5 2 21 10 135 6.9 9112.5 70≤75 72.5 5 26 8 362.5 17.24 26281.25 75≤80 77.5 3 29 3 232.5 10.34 18018.75 Total N=29 1782.5 100 112231.3 Use the data in the frequency distribution table above to calculate first quartile, range and inter quartile range.
