We have data from the National Confectioners Association on 6-years worth of candy sales where our response is the amount of candy sold (in millions of dollars) and the predictor is the year of sale. 11 O 04 1 O. 000
We have data from the National Confectioners Association on 6-years worth of candy sales where our response is the amount of candy sold (in millions of dollars) and the predictor is the year of sale. 11 O 04 1 O. 000

College Algebra
7th Edition
ISBN:9781305115545
Author:James Stewart, Lothar Redlin, Saleem Watson
Publisher:James Stewart, Lothar Redlin, Saleem Watson
Chapter1: Equations And Graphs
Section: Chapter Questions
Problem 10T: Olympic Pole Vault The graph in Figure 7 indicates that in recent years the winning Olympic men’s...

Related questions

Question
please do b
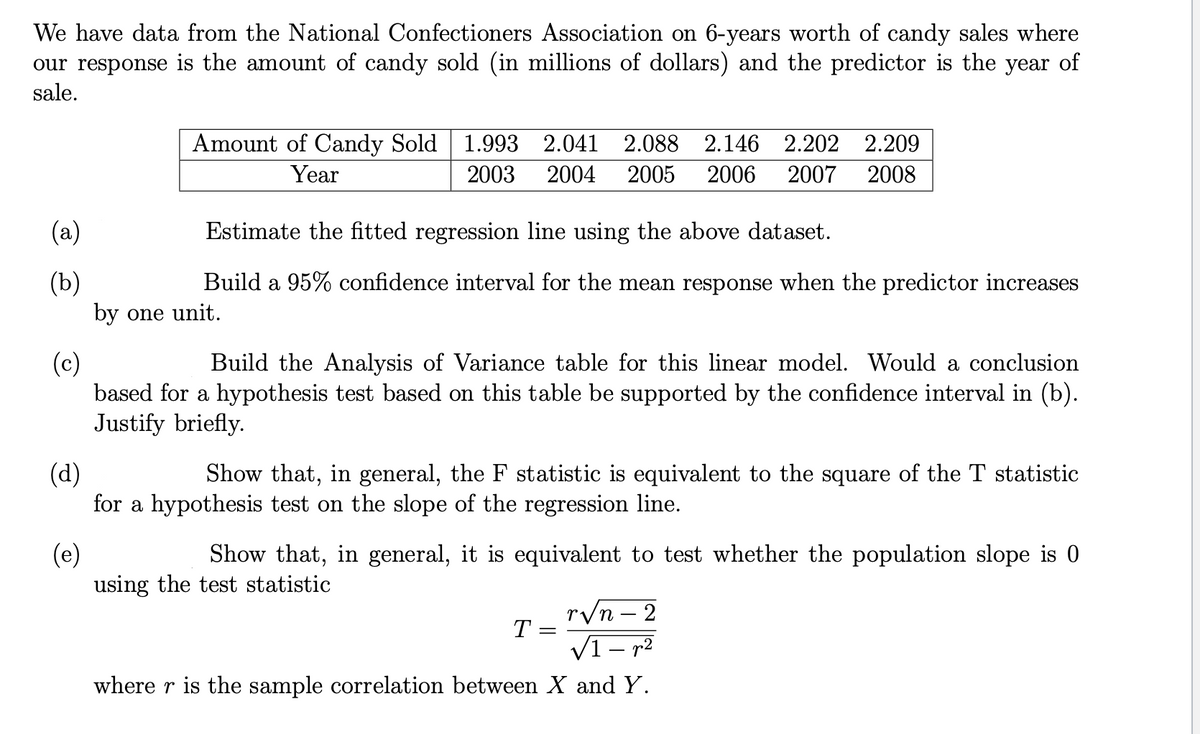
Transcribed Image Text:We have data from the National Confectioners Association on 6-years worth of candy sales where
our response is the amount of candy sold (in millions of dollars) and the predictor is the year of
sale.
Amount of Candy Sold 1.993 2.041 2.088
2.146 2.202 2.209
Year
2003
2004
2005
2006
2007
2008
(a)
Estimate the fitted regression line using the above dataset.
(b)
Build a 95% confidence interval for the mean response when the predictor increases
by one unit.
(c)
based for a hypothesis test based on this table be supported by the confidence interval in (b).
Justify briefly.
Build the Analysis of Variance table for this linear model. Would a conclusion
(d)
for a hypothesis test on the slope of the regression line.
Show that, in general, the F statistic is equivalent to the square of the T statistic
(e)
using the test statistic
Show that, in general, it is equivalent to test whether the population slope is 0
r/n – 2
T =
'п -
V1- r2
where r is the sample correlation between X and Y.
Expert Solution
This question has been solved!
Explore an expertly crafted, step-by-step solution for a thorough understanding of key concepts.

This is a popular solution!

Trending now
This is a popular solution!

Step by step
Solved in 5 steps with 8 images

Knowledge Booster


Learn more about
Need a deep-dive on the concept behind this application? Look no further. Learn more about this topic, statistics and related others by exploring similar questions and additional content below.Recommended textbooks for you
College Algebra
Algebra
ISBN:
9781305115545
Author:
James Stewart, Lothar Redlin, Saleem Watson
Publisher:
Cengage Learning

Linear Algebra: A Modern Introduction
Algebra
ISBN:
9781285463247
Author:
David Poole
Publisher:
Cengage Learning
College Algebra
Algebra
ISBN:
9781305115545
Author:
James Stewart, Lothar Redlin, Saleem Watson
Publisher:
Cengage Learning
Linear Algebra: A Modern Introduction
Algebra
ISBN:
9781285463247
Author:
David Poole
Publisher:
Cengage Learning