we used a least-squares regression line to model the relationship between p 3. and miles driven for 41 used Dodge Chargers. The Coefficient of Determination, r', was calculated to be 67%. Interpret the value r=0.67 for this model. %3D
we used a least-squares regression line to model the relationship between p 3. and miles driven for 41 used Dodge Chargers. The Coefficient of Determination, r', was calculated to be 67%. Interpret the value r=0.67 for this model. %3D

Functions and Change: A Modeling Approach to College Algebra (MindTap Course List)
6th Edition
ISBN:9781337111348
Author:Bruce Crauder, Benny Evans, Alan Noell
Publisher:Bruce Crauder, Benny Evans, Alan Noell
Chapter3: Straight Lines And Linear Functions
Section3.CR: Chapter Review Exercises
Problem 16CR: XYZ Corporation Stock Prices The following table shows the average stock price, in dollars, of XYZ...

Related questions
Question
Q3
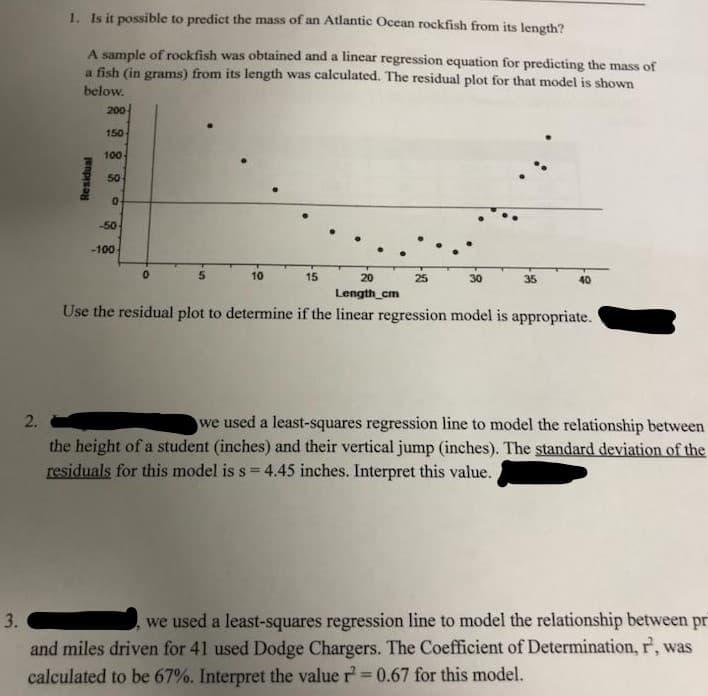
Transcribed Image Text:1. Is it possible to predict the mass of an Atlantic Ocean rockfish from its length?
A sample of rockfish was obtained and a linear regression equation for predicting the mass of
a fish (in grams) from its length was calculated. The residual plot for that model is shown
below.
200
150
100
50
-50
-100
10
15
20
25
30
35
40
Length_cm
Use the residual plot to determine if the linear regression model is appropriate.
2.
we used a least-squares regression line to model the relationship between
the height of a student (inches) and their vertical jump (inches). The standard deviation of the
residuals for this model is s = 4.45 inches. Interpret this value.
we used a least-squares regression line to model the relationship between pr
and miles driven for 41 used Dodge Chargers. The Coefficient of Determination, r, was
calculated to be 67%. Interpret the value r=0.67 for this model.
Residual
3.
Expert Solution
This question has been solved!
Explore an expertly crafted, step-by-step solution for a thorough understanding of key concepts.

Step by step
Solved in 2 steps

Recommended textbooks for you
Functions and Change: A Modeling Approach to Coll…
Algebra
ISBN:
9781337111348
Author:
Bruce Crauder, Benny Evans, Alan Noell
Publisher:
Cengage Learning

Algebra and Trigonometry (MindTap Course List)
Algebra
ISBN:
9781305071742
Author:
James Stewart, Lothar Redlin, Saleem Watson
Publisher:
Cengage Learning

College Algebra
Algebra
ISBN:
9781305115545
Author:
James Stewart, Lothar Redlin, Saleem Watson
Publisher:
Cengage Learning
Functions and Change: A Modeling Approach to Coll…
Algebra
ISBN:
9781337111348
Author:
Bruce Crauder, Benny Evans, Alan Noell
Publisher:
Cengage Learning
Algebra and Trigonometry (MindTap Course List)
Algebra
ISBN:
9781305071742
Author:
James Stewart, Lothar Redlin, Saleem Watson
Publisher:
Cengage Learning
College Algebra
Algebra
ISBN:
9781305115545
Author:
James Stewart, Lothar Redlin, Saleem Watson
Publisher:
Cengage Learning

Elementary Linear Algebra (MindTap Course List)
Algebra
ISBN:
9781305658004
Author:
Ron Larson
Publisher:
Cengage Learning

Glencoe Algebra 1, Student Edition, 9780079039897…
Algebra
ISBN:
9780079039897
Author:
Carter
Publisher:
McGraw Hill

Big Ideas Math A Bridge To Success Algebra 1: Stu…
Algebra
ISBN:
9781680331141
Author:
HOUGHTON MIFFLIN HARCOURT
Publisher:
Houghton Mifflin Harcourt