What is the equation for the least.square regression line where the independent or predictor variable is petal length and the dependent or response variable is petal width for iris versicolor? =Ex 1.234 I+ Ex: 1.234 What is the predicted petal width for iris versicolor for a flower with a petal length of 4.1? Ex: 5.12 cn
What is the equation for the least.square regression line where the independent or predictor variable is petal length and the dependent or response variable is petal width for iris versicolor? =Ex 1.234 I+ Ex: 1.234 What is the predicted petal width for iris versicolor for a flower with a petal length of 4.1? Ex: 5.12 cn

College Algebra
7th Edition
ISBN:9781305115545
Author:James Stewart, Lothar Redlin, Saleem Watson
Publisher:James Stewart, Lothar Redlin, Saleem Watson
Chapter1: Equations And Graphs
Section: Chapter Questions
Problem 10T: Olympic Pole Vault The graph in Figure 7 indicates that in recent years the winning Olympic men’s...

Related questions

Topic Video
Question
Hi,
Please answer all parts.
Also, please credit my account 1 question as the last answer I received was incorrect.
Thank you!
Transcribed Image Text:zyBooks cata
CHALLENGE ACTIVITY
2.3.2: Excel: Linear regression.
Click this link to download the spreadsheet for use in this activity.
Jump to level1
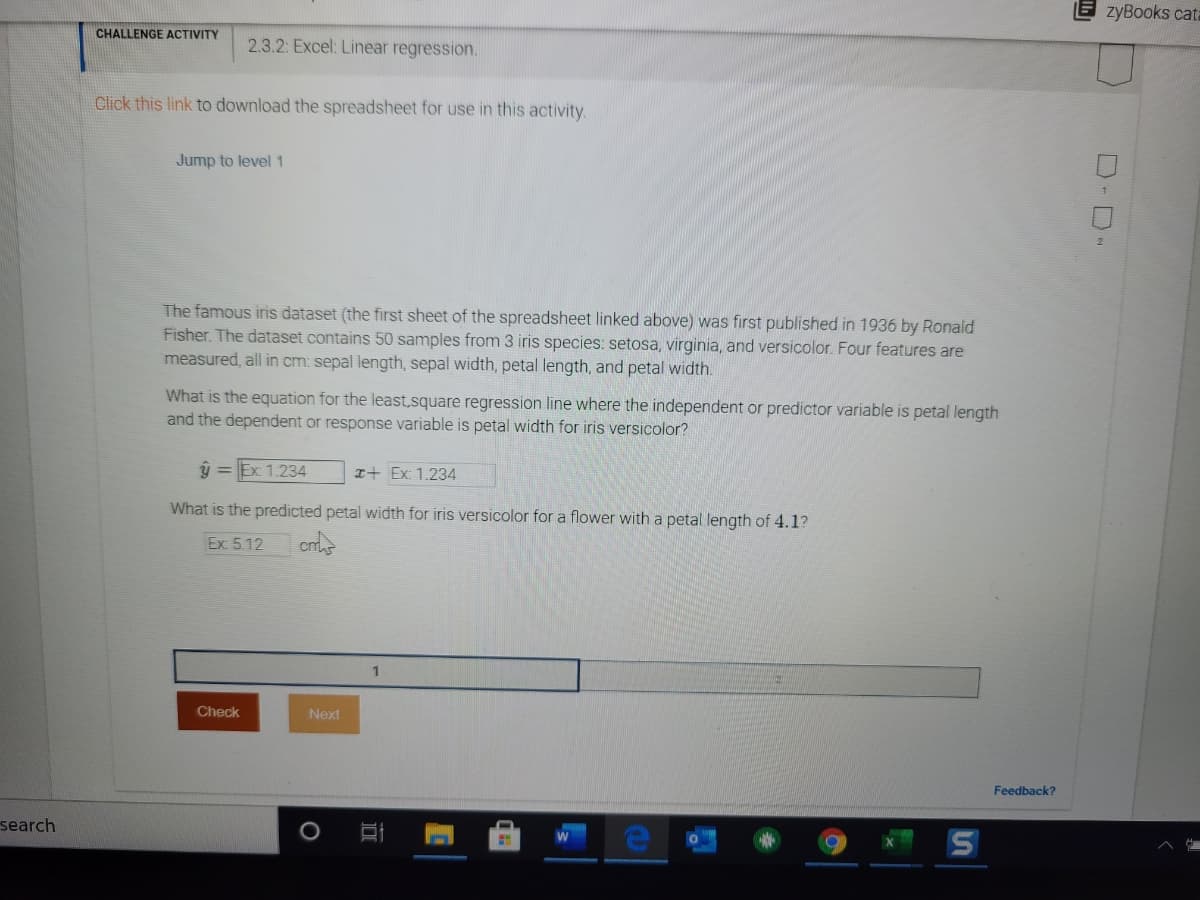
The famous iris dataset (the first sheet of the spreadsheet linked above) was first published in 1936 by Ronald
Fisher. The dataset contains 50 samples from 3 iris species: setosa, virginia, and versicolor. Four features are
measured, all in cm: sepal length, sepal width, petal length, and petal width.
What is the equation for the least,square regression line where the independent or predictor variable is petal length
and the dependent or response variable is petal width for iris versicolor?
ý = Ex 1.234
I+ Ex: 1.234
What is the predicted petal width for iris versicolor for a flower with a petal length of 4.1?
Ex: 5.12
Check
Next
Feedback?
search
D-D
Transcribed Image Text:5:31 O OA
HG 84%
44 - Unsaved
fx
A
B
D
E
F
G
H
1
2
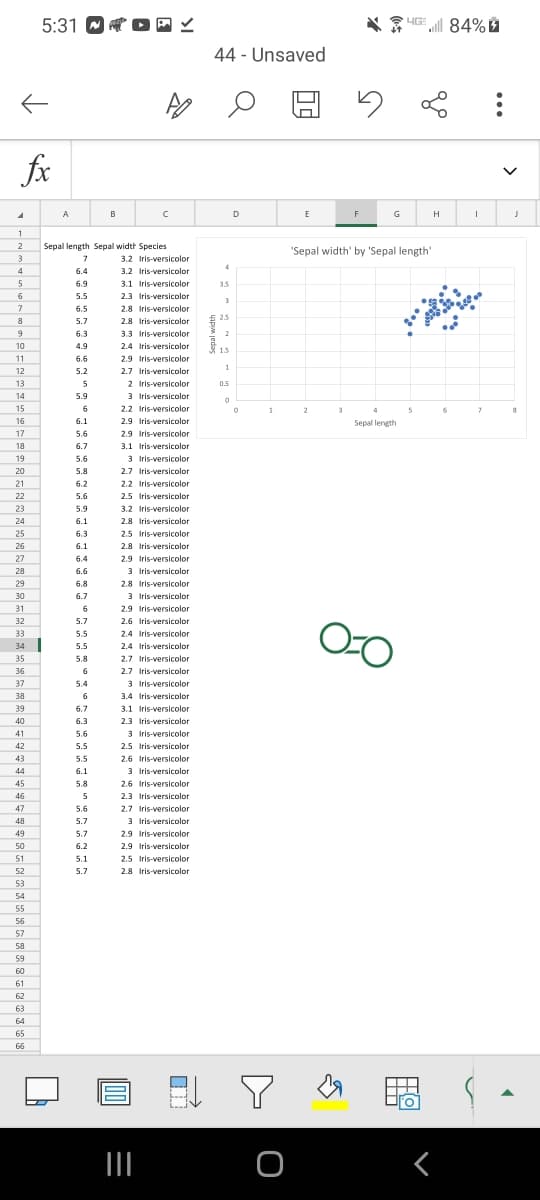
Sepal length Sepal width Species
"Sepal width' by 'Sepal length
3
3.2 Iris-versicolor
4
6.4
3.2 Iris-versicolor
5
6.9
3.1 Iris-versicolor
3.5
6
5.5
2.3 Iris-versicolor
3
7
6.5
2.8 Iris-versicolor
2.5
8
5.7
2.8 Iris-versicolor
6.3
3.3 Iris-versicolor
2
10
4.9
2.4 Iris-versicolor
11
6.6
2.9 Iris-versicolor
1
12
5.2
2.7 Iris-versicolor
13
2 Iris-versicolor
3 Iris-versicolor
2.2 Iris-versicolor
0.5
14
5.9
15
6.
1
2
4
5
16
6.1
2.9 Iris-versicolor
Sepal length
17
5.6
2.9 Iris-versicolor
18
6.7
3.1 Iris-versicolor
19
5.6
3 Iris-versicolor
20
5.8
2.7 Iris-versicolor
21
6.2
2.2 Iris-versicolor
22
5.6
2.5 Iris-versicolor
23
5.9
3.2 Iris-versicolor
24
6.1
2.8 Iris-versicolor
25
6.3
2.5 Iris-versicolor
26
6.1
2.8 Iris-versicolor
27
6.4
2.9 Iris-versicolor
28
6.6
3 Iris-versicolor
29
6.8
2.8 Iris-versicolor
30
6.7
3 Iris-versicolor
31
2.9 Iris-versicolor
32
5.7
2.6 Iris-versicolor
33
5.5
2.4 Iris-versicolor
34
5.5
2.4 Iris-versicolor
35
5.8
2.7 Iris-versicolor
36
6
2.7 Iris-versicolor
3 Iris-versicolor
3.4 Iris-versicolor
37
5.4
38
6
39
6.7
3.1 Iris-versicolor
40
6.3
2.3 Iris-versicolor
41
5.6
3 Iris-versicolor
42
5.5
2.5 Iris-versicolor
43
5.5
2.6 Iris-versicolor
44
6.1
3 Iris-versicolor
45
5.8
2.6 Iris-versicolor
46
2.3 Iris-versicolor
47
5.6
2.7 Iris-versicolor
3 Iris-versicolor
2.9 Iris-versicolor
48
5.7
49
5.7
50
6.2
2.9 Iris-versicolor
51
5.1
2.5 Iris-versicolor
52
5.7
2.8 Iris-versicolor
53
54
55
56
57
58
59
60
61
62
63
64
65
66
dro
Sepal width
Expert Solution
This question has been solved!
Explore an expertly crafted, step-by-step solution for a thorough understanding of key concepts.

This is a popular solution!

Trending now
This is a popular solution!

Step by step
Solved in 3 steps with 2 images

Knowledge Booster


Learn more about
Need a deep-dive on the concept behind this application? Look no further. Learn more about this topic, statistics and related others by exploring similar questions and additional content below.Recommended textbooks for you
College Algebra
Algebra
ISBN:
9781305115545
Author:
James Stewart, Lothar Redlin, Saleem Watson
Publisher:
Cengage Learning

Algebra and Trigonometry (MindTap Course List)
Algebra
ISBN:
9781305071742
Author:
James Stewart, Lothar Redlin, Saleem Watson
Publisher:
Cengage Learning

Functions and Change: A Modeling Approach to Coll…
Algebra
ISBN:
9781337111348
Author:
Bruce Crauder, Benny Evans, Alan Noell
Publisher:
Cengage Learning
College Algebra
Algebra
ISBN:
9781305115545
Author:
James Stewart, Lothar Redlin, Saleem Watson
Publisher:
Cengage Learning
Algebra and Trigonometry (MindTap Course List)
Algebra
ISBN:
9781305071742
Author:
James Stewart, Lothar Redlin, Saleem Watson
Publisher:
Cengage Learning
Functions and Change: A Modeling Approach to Coll…
Algebra
ISBN:
9781337111348
Author:
Bruce Crauder, Benny Evans, Alan Noell
Publisher:
Cengage Learning