Weeds are common in corn fields. Does the presence ofweeds reduce the yield of the corn? Researchers planted corn in five plots of ground, then divided each plot in half. In each plot, one half was randomly selected and weeded, while the other half was not. Here are the yields of corn (bushels per acre) in each section of the test area: Plot: 1 2 3 4 5 Weeded half: 166.7 172.2 165.0 176.9 158.2 Unweeded half: 158.6 176.4 153.1 156.0 155.0 (a) Determine the value of the test statistic for the appropriate rank test.
Weeds are common in corn fields. Does the presence ofweeds reduce the yield of the corn? Researchers planted corn in five plots of ground, then divided each plot in half. In each plot, one half was randomly selected and weeded, while the other half was not. Here are the yields of corn (bushels per acre) in each section of the test area: Plot: 1 2 3 4 5 Weeded half: 166.7 172.2 165.0 176.9 158.2 Unweeded half: 158.6 176.4 153.1 156.0 155.0 (a) Determine the value of the test statistic for the appropriate rank test.

Glencoe Algebra 1, Student Edition, 9780079039897, 0079039898, 2018
18th Edition
ISBN:9780079039897
Author:Carter
Publisher:Carter
Chapter10: Statistics
Section10.6: Summarizing Categorical Data
Problem 11CYU

Related questions

Question
100%
Can you please help with part (a) of statistics question attached
Please do not reject question if it is too complex for you and you do not know how to solve this problem.
Allow another expert a chance to answer this question.
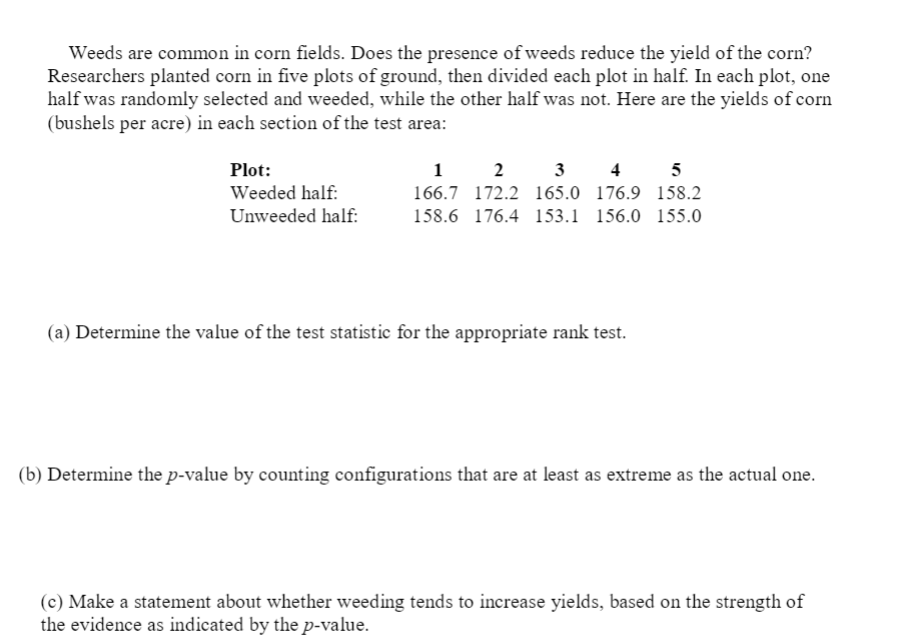
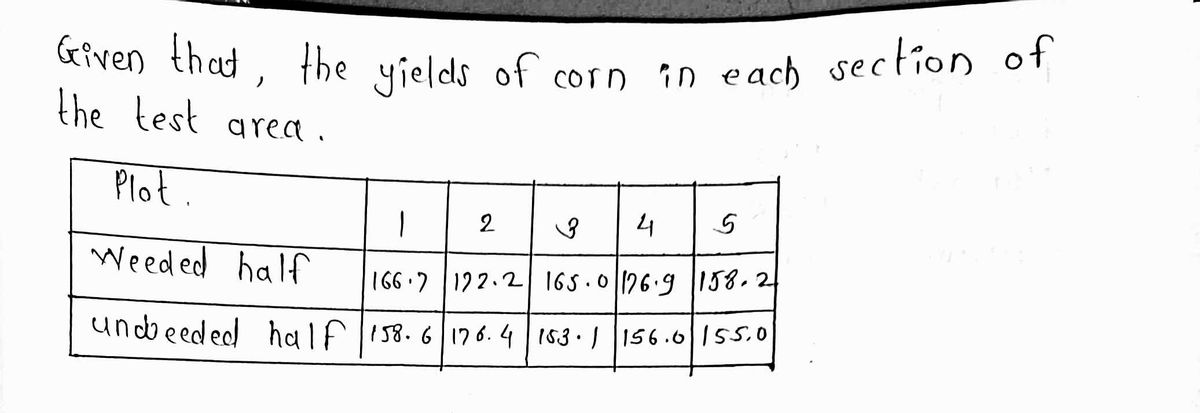
Transcribed Image Text:Weeds are common in corn fields. Does the presence ofweeds reduce the yield of the corn?
Researchers planted corn in five plots of ground, then divided each plot in half. In each plot, one
half was randomly selected and weeded, while the other half was not. Here are the yields of corn
(bushels per acre) in each section of the test area:
Plot:
1
2
3
4
5
Weeded half:
166.7 172.2 165.0 176.9 158.2
Unweeded half:
158.6 176.4 153.1 156.0 155.0
(a) Determine the value of the test statistic for the appropriate rank test.
(b) Determine the p-value by counting configurations that are at least as extreme as the actual one.
(c) Make a statement about whether weeding tends to increase yields, based on the strength of
the evidence as indicated by the p-value.
Expert Solution
Step 1

Step by step
Solved in 3 steps with 3 images

Knowledge Booster


Learn more about
Need a deep-dive on the concept behind this application? Look no further. Learn more about this topic, statistics and related others by exploring similar questions and additional content below.Recommended textbooks for you
Glencoe Algebra 1, Student Edition, 9780079039897…
Algebra
ISBN:
9780079039897
Author:
Carter
Publisher:
McGraw Hill

Holt Mcdougal Larson Pre-algebra: Student Edition…
Algebra
ISBN:
9780547587776
Author:
HOLT MCDOUGAL
Publisher:
HOLT MCDOUGAL

Algebra: Structure And Method, Book 1
Algebra
ISBN:
9780395977224
Author:
Richard G. Brown, Mary P. Dolciani, Robert H. Sorgenfrey, William L. Cole
Publisher:
McDougal Littell
Glencoe Algebra 1, Student Edition, 9780079039897…
Algebra
ISBN:
9780079039897
Author:
Carter
Publisher:
McGraw Hill
Holt Mcdougal Larson Pre-algebra: Student Edition…
Algebra
ISBN:
9780547587776
Author:
HOLT MCDOUGAL
Publisher:
HOLT MCDOUGAL
Algebra: Structure And Method, Book 1
Algebra
ISBN:
9780395977224
Author:
Richard G. Brown, Mary P. Dolciani, Robert H. Sorgenfrey, William L. Cole
Publisher:
McDougal Littell

Algebra & Trigonometry with Analytic Geometry
Algebra
ISBN:
9781133382119
Author:
Swokowski
Publisher:
Cengage