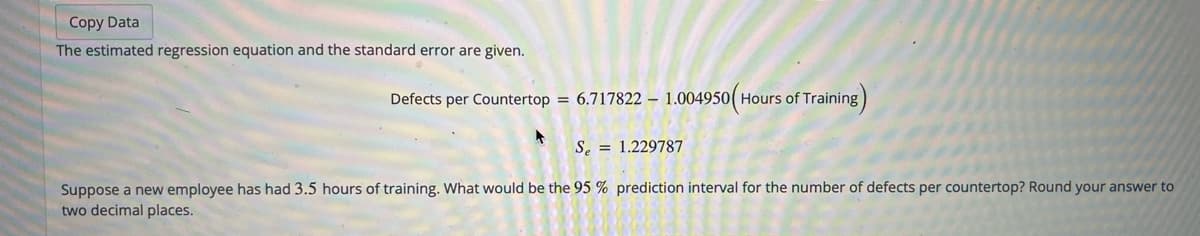
The estimated regression equation and the standard error are given. Defects per Countertop = 6.717822 – Hours of Training) S. = 1.229787 Suppose a new employee has had 3.5 hours of training. What would be the 95 % prediction interval for the number of defects per countertop? Round your answer to two decimal places.


Q: Use Microsoft Excel to generate regression output for this problem and use the information in the…
A:
Q: The following estimated regression equation based on 30 observations was presented. ŷ= 17.6+…
A: The value of SST is 1801 and the value of SSR is 1756.
Q: The following multiple regression printout can be used to predict a person's height (in inches)…
A: (a) Obtain the value of the test statistic for the shoe size. The value of the test statistic for…
Q: In this regression, which test statistic would you use to test the null hypothesis that the…
A: The prediction can be done by various time series method. It can be calculated using the regression…
Q: The following estimated regression equation based on 30 observations was presented. ŷ = 17.6 + 3.8x,…
A:
Q: A regression between foot length(response variable in cm) and height (eexplanatory variable in…
A: From the given information, The regression equation can be shown below: y⏞=10.9+0.23x Where Y =foot…
Q: What is the predicted value for accidents per 1000 licenses for a city that has 13% of its licensed…
A:
Q: a) Write out the regression equation. b) Fill in the missing values *, **, *** and ****. c) Use the…
A: The study is about the relationship between the prices of houses, how many bedrooms, House size in…
Q: In a quantitative dataset, which would be smaller, the standard deviation or the standard error of…
A: Since you have asked multiple questions, we will solve the first question for you. If you want any…
Q: By visual inspection, determine the best-fitting regression model for the scatterplot. y
A:
Q: Consider the set of ordered pairs shown below. Assuming that the regression equation is y = 4.293…
A: Given : The regression equation is: Y^=4.2917+0.2083X \hat Y = 4.2917 + 0.2083 X Now that we have…
Q: In a regression analysis involving 30 observations, the following estimated regression equation was…
A: The sum of square for regression is 1,810, and total sum of square is 1,855. The sum of squares for…
Q: Using the previous regression model, what salary would you expect a 23 year old male student with a…
A: In this case, salary is the dependent variable, and age, GPA and Gender_num are the dependent…
Q: Listed below are the overhead widths (am) of seals measured from photographs and weights (kg) of the…
A:
Q: Consider the set of ordered pairs shown below. Assuming that the regression equation is y = 1.334…
A:
Q: Use the following linear regression equation to answer the questions. x1 = 1.7 + 3.9x2 – 8.5x3 +…
A: Given linear equation, x1 = 1.7 + 3.9x2 – 8.5x3 + 2.2x4 Suppose x3 and x4 were held at fixed but…
Q: 1. What are the assumptions underlying multiple regression analysis when one wishes to infer about…
A: 1. Assumptions of the multiple regression analysis: Variable type: Both, categorical and…
Q: So, =0.1902. A researcher developed a regression model to predict the cost of a meal based on the…
A: According to the policy we are permitted to solve only 4 sub parts.
Q: what is the best-predicted weight for a bear with 43 inches, and What is the regression equation?
A: The variable x represents the chest size and y represents the weight.
Q: The regression equation below was estimated using a random sample of 27 pairs of X, y observations.…
A:
Q: Assume we have a population data, and the following values were obtained Mean of X=6, Standard…
A:
Q: Suppose we wanted to predict the number of people killed for a magnitude 10.0 earthquake. Using the…
A:
Q: Suppose you are investigating a dataset and creating a sample linear regression model that yields a…
A: Assume that the β1 is the population slope coefficient.
Q: For the data and sample regression equation shown below, do the following. a. Decide, at the 10%…
A: Given: n = 4 Y = -1.5 + 1.1X Formula Used: Test-statistic t = b-βSe Confidence interval = b ± t*se
Q: Listed below are altitudes (thousands of feet) and outside air temperatures (°F) recorded during…
A: These are the data that have been provided for the dependent and independent variable: Obs. XX =…
Q: Find the equation of the regression line for the given data. Round values to the thousandth
A: Solution: Number of counts (n) = 10 x y xy x2 -5 11 -55 25 -3 6 -18 9 4 -6 -24 16…
Q: The regression equation is Ý = 29.29 – 0.96X, the sample size is 8, and the standard error of the…
A: Given that Sample size n = 8 Standard error of slope = 0.22 Level of significance = 0.01
Q: Respond to the following prompts in your initial post: 1. Identify the explanatory variables and…
A: Since there are multiple sub-parts, as per the honor code the first three sub-parts will be solved.…
Q: As part of your job as a sales manager for a local car dealership, you want to investigate the…
A:
Q: The following estimated regression equation based on 10 observations was presented. ŷ = 23.1170 +…
A: Given information: The sample size is n = 10. The given values are as follows:
Q: The data on y = annual sales ($1,000s) for new customer accounts and x = number of years of…
A: ŷ = 80 + 4x. For these data, x¯ = 7, Σ(xi − x)2 = 142, and s = 4.6098
Q: 4. Find the regression equation for predicting final score from midterm score, based on the…
A: For solution number 4 Given: y¯f=70sf=10x¯m=55sm=20r=0.60
Q: d) Did the estimated regression equation provide a good fit? Explain. e) Use the estimated…
A: Regression analysis is used measure the association between two are more variables.Where one…
Q: How much of the variation in mean cost of hospital stay is explained by the least-squares regression…
A: Given: Cost, y Number x 10.3 34.1 10.3 34.2 11.3 34.7 11.8 34.9 12.5 35.5 13.7 36.4…
Q: Does a high value of r2 imply that two variables are causally related? Explain.
A:
Q: The following estimated regression equation based on 30 observations was presented. ŷ = 17.6 + 3.8x1…
A: (a) The values of SST and SSR are 1,807 and 1,757, respectively. The value of R2 is,…
Q: Make up a question that would involve interpolation and the use of the model (regression equation)…
A: Since the question number is not specified, we'll be answering the first question only. Please…
Q: Listed below are altitudes (thousands of feet) and outside air temperatures (°F) recorded during…
A: Listed below are altitudes (thousands of feet) and outside air temperatures (°F) recorded during…
Q: d) Did the estimated regression equation provide a good fit? Explain. e) Use the estimated…
A: The relationship is investigated using regression analysis which is done with the help of Microsoft…
Q: (1) Write out the regression equation (2) What is the sample size used in this investigation? (3)…
A: 1) From the output, the coefficient of constant is 42.085
Q: For the regression equation, Ŷ = –2X + 6, if the X value is above the mean (positive deviation),…
A: We have to find correct statement for y.
Q: Based on the sample data and the regression line, answer the following. (a) From the regression…
A: From the given data and the regression line equation between birthrate (x) and female life…
Q: A random sample of ten professional athletes produced the following data. The first row is the…
A: Given data, X Y X*Y X*X 0 2 0 0 3 8 24 9 2 7 14 4 1 3 3 1 5 13 65 25 5 12 60 25 4 9…
Q: The accompanying table lists systolic blood pressures (mm Hg) and diastolic blood pressures (mm…
A: These are the data that have been provided for the dependent and independent variables: Obs. XX =…
Q: From the regression equation, what is the predicted percentage increase in sales when the…
A: It is given that x representing campaign cost and y representing the resulting percentage increase…
Q: The data on y = annual sales ($1,000s) for new customer accounts and x = number of years of…
A: For the given data Find ( a ) 95% confidence interval = ? ( b ) 95% prediction interval = ?
Q: One of the lines in the following scatter plot is the regression line fitted to the data. Which of…
A: Given: One of the lines in the scatter plot is the regression line fitted to the data. (a) The red…
Q: The trip rate (y) and the corresponding household sizes (x) from a sample are shown in Table Q2.…
A: Simple linear regression model: A simple linear regression model is given as y^ = b0 + bx + e…


Trending now
This is a popular solution!

Step by step
Solved in 3 steps with 3 images

- In a study of chromosomal anomalies observed in a randomly selected sample of 1200 infertile men with either a zero or low sperm count, a team of researchers assigned the value of 1 for the presence of any chromosomal anomaly in the subject's sperm and the value of 0 for the absence of all chromosomal anomalies in the subject's sperm.Of the 600 men with zero sperm count, 48 had chromosomal anomalies. Of the 600 men with low sperm count, 15 had chromosomal anomalies. The researchers would like to test the hypothesesHo: P1 = P2Ha: P1 does not equal P2where p₁ the true proportion of all men with zero sperm count that have chromosomal anomalies and p₂ = the true proportion of all men with low sperm count that have chromosomal anomalies.What is the z standardized test statistic, for this test?Aircraft primer paints are applied to aluminum surfaces by two methods: dipping and spraying. The purpose of using the primer is to improve paint adhesion, and some parts can be primed using either application method. The process engineering group responsible for this operation is interested in learning whether three different primers differ in their adhesion properties. A factorial experiment was performed to investigate the effect of paint primer type and application method on paint adhesion. For each combination of primer type and application method, three specimens were painted, then a finish paint was applied, and the adhesion force was measured. - What is/are the factor/s in the study? What are the levels? What are the experimental units?A study of fox rabies in a country gave the following information about different regions and the occurrence of rabies in each region. A random sample of n1 = 16 locations in region I gave the following information about the number of cases of fox rabies near that location. x1: Region I Data 2 9 9 9 7 8 8 1 3 3 3 2 5 1 4 6 A second random sample of n2 = 15 locations in region II gave the following information about the number of cases of fox rabies near that location. x2: Region II Data 1 1 3 1 4 8 5 4 4 4 2 2 5 6 9
- A geneticist working on peas has a single plant monohybrid Y/y (yellow) plant and, from a self of this plant,wants to produce a plant of genotype y/y to use as a tester. How many progeny plants need to be grown to be 95percent sure of obtaining at least one in the sample?A study of fox rabies in a country gave the following information about different regions and the occurrence of rabies in each region. A random sample of n1 = 16 locations in region I gave the following information about the number of cases of fox rabies near that location. x1: Region I Data 2 9 9 9 6 8 8 1 3 3 3 2 5 1 4 6 A second random sample of n2 = 15 locations in region II gave the following information about the number of cases of fox rabies near that location. x2: Region II Data 2 2 5 2 4 8 5 4 4 4 2 2 5 6 9 (i) Use a calculator with sample mean and sample standard deviation keys to calculate x1 and s1 in region I, and x2 and s2 in region II. (Round your answers to two decimal places.) x1 = s1 = x2 = s2 = (ii) Does this information indicate that there is a difference (either way) in the mean number of cases of fox rabies between the two regions? Use a 5% level of significance. (Assume the distribution of rabies cases in both…A study of fox rabies in a country gave the following information about different regions and the occurrence of rabies in each region. A random sample of n1 = 16 locations in region I gave the following information about the number of cases of fox rabies near that location. x1: Region I Data 1 9 9 9 7 8 8 1 3 3 3 2 5 1 4 6 A second random sample of n2 = 15 locations in region II gave the following information about the number of cases of fox rabies near that location. x2: Region II Data 1 1 5 1 6 8 5 4 4 4 2 2 5 6 9 What is the value of the sample test statistic? (Test the difference μ1 − μ2. Do not use rounded values. Round your final answer to three decimal places.)
- A study of fox rabies in a country gave the following information about different regions and the occurrence of rabies in each region. A random sample of n1 = 16 locations in region I gave the following information about the number of cases of fox rabies near that location. x1: Region I Data 2 8 8 8 6 8 8 1 3 3 3 2 5 1 4 6 A second random sample of n2 = 15 locations in region II gave the following information about the number of cases of fox rabies near that location. x2: Region II Data 1 1 5 1 4 8 5 4 4 4 2 2 5 6 9 (i) Use a calculator with sample mean and sample standard deviation keys to calculate x1 and s1 in region I, and x2 and s2 in region II. (Round your answers to two decimal places.) x1 = s1 = x2 = s2 = (ii) Does this information indicate that there is a difference (either way) in the mean number of cases of fox rabies between the two regions? Use a 5% level of significance. (Assume the distribution of rabies cases in both regions is…Can attack of a plant by one organism induce resistance to subsequent attack by a different organism? In a study of this question, individually potted cotton plants were randomly allocated to two groups. Each plant in one group received an infestation of spider mites; the other group were kept as controls. After 2 weeks the mites were removed, and all plants were inoculated with a fungus that causes wilt disease. According to the research question, H0: Miles do not induce resistance to wilt. Ha: Mites do induce resistance to wilt. What is the alternative hypothesis in symbols when p represents the proportion of wilt disease in a group? p1 < p2 or p1 > p2?Based on advancements in drug therapy, a pharmaceutical company is developing Resithan, a new treatment for depression. A medical researcher for the company is studying the effectiveness of Resithan as compared to their existing drug, Exemor. A random sample of 461 depressed individuals is selected and treated with Resithan, and 172 find relief from their depression. A random sample of 419 depressed individuals is independently selected from the first sample and treated with Exemor, and 121 find relief from their depression. Based on the medical researcher's study can we conclude, at the 0.01 level of significance, that the proportion p1 of all depressed individuals taking Resithan who find relief from depression is greater than the proportion p2 of all depressed individuals taking Exemor who find relief from depression? Perform a one-tailed test. Then complete the parts below. Carry your intermediate computations to three or more decimal places and round your answers as…
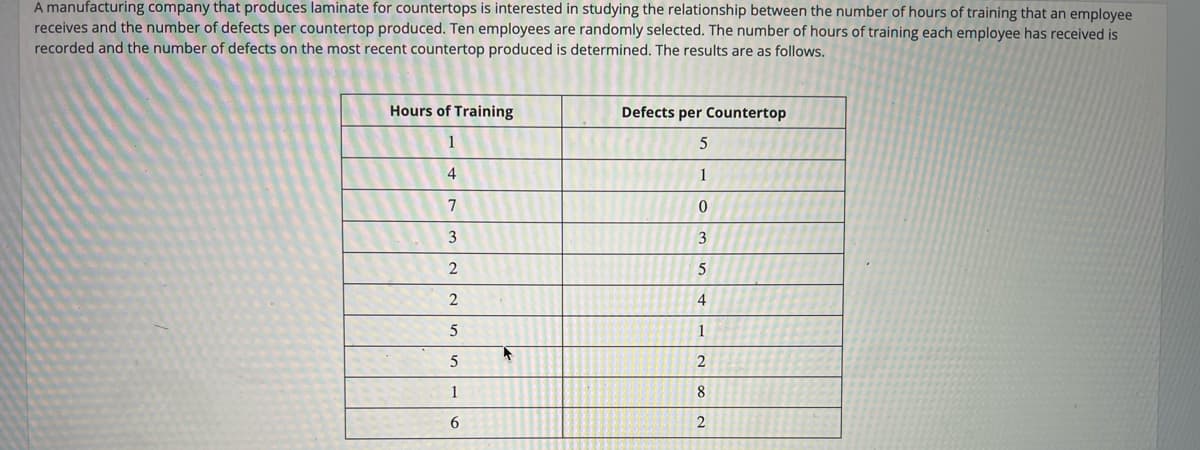
- A manufacturing company that produces laminate for countertops is interested in studying the relationship between the number of hours of training that an employee receives and the number of defects per countertop produced. Ten employees are randomly selected. The number of hours of training each employee has received is recorded and the number of defects on the most recent countertop produced is determined. The results are as follows. Hours of Training Defects per Countertop 11 55 44 11 77 00 33 33 22 55 22 44 55 11 55 22 11 88 66 22 Copy Data The estimated regression line and the standard error are given. Defects per Countertop=6.717822−1.004950(Hours of Training)Defects per Countertop=6.717822−1.004950(Hours of Training)se=1.229787se=1.229787 Suppose a new employee has had 44 hours of training. What would be the 99%99% prediction interval for the number of defects per countertop? Round your answer to two decimal places.A study of fox rabies in southern Germany gave the following information about different regions and the occurrence of rabies in each region. A random sample of n1 = 16 locations in region 1 gave the following information about the number of cases of fox rabies near that location. x1: Region I Data 2 7 7 7 7 8 8 1 3 3 3 2 5 1 4 6 A second random sample of n2 = 15 locations in region II gave the following information about the number of cases of fox rabies near that location. x2: Region II Data 1 3 4 3 3 8 5 4 4 4 2 2 5 6 9 (a) Does this information indicate that there is a difference (either way) in the mean number of cases of fox rabies between the two regions? Use a 5% level of significance. (Assume the distribution of rabies cases in both regions is mound-shaped and approximately normal.) (i) What is the level of significance?State the null and alternate hypotheses. H0: μ1 ≠ μ2; H1: μ1 = μ2H0: μ1 = μ2; H1: μ1 ≠ μ2 H0: μ1 > μ2; H1: μ1 = μ2 H0: μ1 = μ2;…A study of fox rabies in southern Germany gave the following information about different regions and the occurrence of rabies in each region. A random sample of n1 = 16 locations in region 1 gave the following information about the number of cases of fox rabies near that location. x1: Region I Data 2 7 7 7 7 8 8 1 3 3 3 2 5 1 4 6 A second random sample of n2 = 15 locations in region II gave the following information about the number of cases of fox rabies near that location. x2: Region II Data 1 3 4 3 3 8 5 4 4 4 2 2 5 6 9 (b) Find a 95% confidence interval for μ1 − μ2. (Round your answers to two decimal places.) lower limit upper limit