What is the mean difference in the hours of sleep? (Use 4, - 42, where 4, is the amount of sleep South Carolinians had and Hz is the amount of sleep North Carolinians had.) hours Which state, on average slept more? O North Carolina (NC) O South Carolina (Sc) O not enough information O (b) Find the 95% confidence interval for the difference in means of the hours slept.
What is the mean difference in the hours of sleep? (Use 4, - 42, where 4, is the amount of sleep South Carolinians had and Hz is the amount of sleep North Carolinians had.) hours Which state, on average slept more? O North Carolina (NC) O South Carolina (Sc) O not enough information O (b) Find the 95% confidence interval for the difference in means of the hours slept.

MATLAB: An Introduction with Applications
6th Edition
ISBN:9781119256830
Author:Amos Gilat
Publisher:Amos Gilat
Chapter1: Starting With Matlab
Section: Chapter Questions
Problem 1P

Related questions

Question
Transcribed Image Text:O (a)
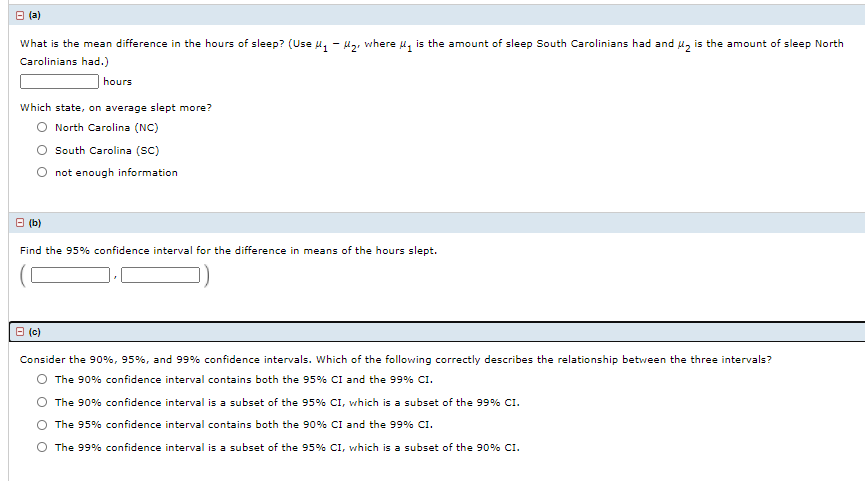
What is the mean difference in the hours of sleep? (Use u, - Hg, where u, is the amount of sleep South Carolinians had and u, is the amount of sleep North
Carolinians had.)
hours
Which state, on average slept more?
O North Carolina (NC)
South Carolina (SC)
O not enough information
e (b)
Find the 95% confidence interval for the difference in means of the hours slept.
B (c)
Consider the 90%, 95%, and 99% confidence intervals. Which of the following correctly describes the relationship between the three intervals?
O The 90% confidence interval contains both the 95% CI and the 99% CI.
The 90% confidence interval is a subset of the 95% CI, which is a subset of the 99% CI.
The 95% confidence interval contains both the 90% CI and the 99% Cı.
O The 99% confidence interval is a subset of the 95% CI, which is a subset of the 90% CI.
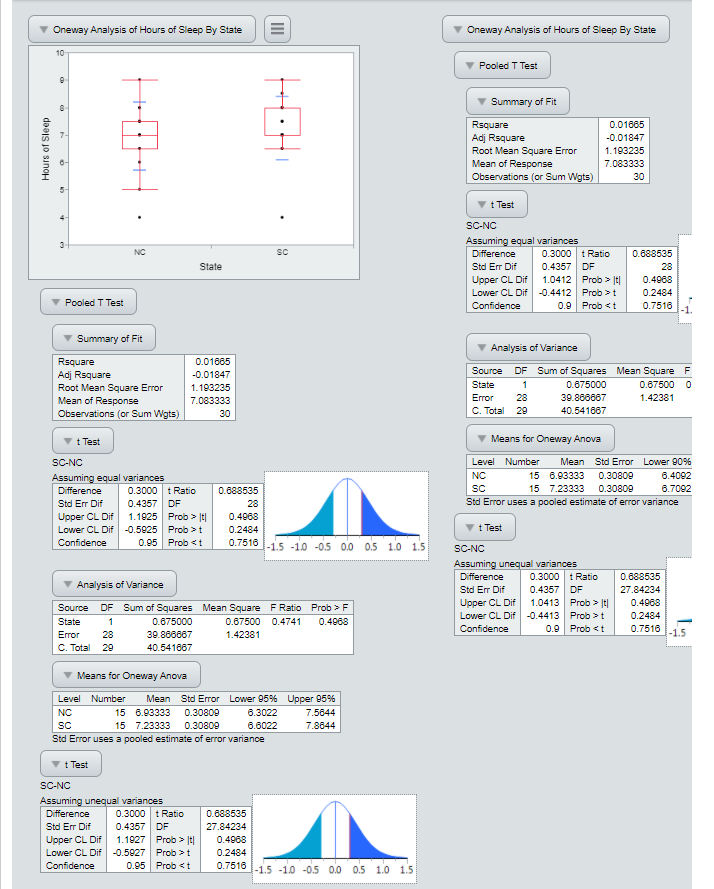
Transcribed Image Text:Oneway Analysis of Hours of Sleep By State
Oneway Analysis of Hours of Sleep By State
10-
Pooled T Test
Summary of Fit
Rsquare
0.01865
Adj Rsquare
Root Mean Square Error
Mean of Response
Observations (or Sum Wgts)
-0.01847
1.193235
7.083333
30
t Test
4-
SC-NC
Assuming equal variances
0.3000 t Ratio
0.4357 DF
1.0412 Prob > It|
3
NC
sc
Difference
0.688535
State
Std Err Dif
28
Upper CL Dif
0.4968
Lower CL Dif -0.4412 Prob >t
0.2484
Pooled T Test
Confidence
0.9 Prob <t
0.7518
-1.
Summary of Fit
Analysis of Variance
Rsquare
0.01665
Source
DF Sum of Squares Mean Square F
Adj Rsquare
Root Mean Square Error
Mean of Response
Observations (or Sum Wgts)
-0.01847
1.193235
State
1
0.675000
0.67500 0
7.083333
Error
28
39.886667
1.42381
30
C. Total 29
40.541667
t Test
Means for Oneway Anova
SC-NC
Level Number
Mean Std Error Lower 90%
NC
15 6.93333
15 7.23333
0.30809
6.4092
Assuming equal variances
0.3000 t Ratio
0.4357 DF
1.1925 Prob > IE|
Difference
0.688535
SC
0.30809
6.7092
Std Err Dif
28
Std Error uses a pooled estimate of error variance
Upper CL Dif
0.4968
Lower CL Dif -0.5925 Prob >t
0.2484
t Test
0.95 Prob <t
0.7516
-1.5 -1.0 -0.5 0.0 0.5 1.0 1.5
Confidence
SC-NC
Assuming unequal variances
0.3000 t Ratio
0.4357 DF
1.0413 Prob > t|
Difference
0.688535
Analysis of Variance
Std Err Dif
27.84234
Upper CL Dif
0.4068
Source DF Sum of Squares Mean Square F Ratio Prob > F
State
Lower CL Dif -0.4413 Prob > t
0.2484
1
0.675000
0.67500
0.4741
0.4968
0.9 Prob <t
0.7516
-1.5
Confidence
Error
28
39.880007
1.42381
C. Total
29
40.541667
Means for Oneway Anova
Level Number
Mean Std Error Lower 95% Upper 95%
NC
15 6.93333
0.30809
6.3022
7.5844
SC
15 7.23333
0.30809
6.6022
7.8844
Std Error uses a pooled estimate of error variance
t Test
SC-NC
Assuming unequal variances
0.3000 t Ratio
0.4357 DF
1.1927 Prob > |t|
Difference
0.688535
Std Err Dif
27.84234
Upper CL Dif
0.4968
Lower CL Dif -0.5927 Prob >t
0.2484
Confidence
0.95 Prob < t
0.7516
-1.5 -1.0 -0.5 0.0 0.5 1.0 1.5
Hours of Sleep
II
Expert Solution
Step 1
From the output, the mean difference between the SC(South Carolinians) and NC (North Carolinians) amount of the sleep is 0.30.
Thus, the difference is 0.3 hours
Since, the difference is positive the mean difference of SC is greater than mean difference of NC.
Thus, correct option is
South Carolina (SC)
Step 2
From the data of the confidence level =0.95,
The upper CL diff = 1.1925
The lower CL diff = -0.5925
Thus, 95% confidence interval for the difference in the mean amount of the sleep is (-0.5925 hours, 1.1925 hours)

Step by step
Solved in 3 steps

Knowledge Booster


Learn more about
Need a deep-dive on the concept behind this application? Look no further. Learn more about this topic, statistics and related others by exploring similar questions and additional content below.Recommended textbooks for you
MATLAB: An Introduction with Applications
Statistics
ISBN:
9781119256830
Author:
Amos Gilat
Publisher:
John Wiley & Sons Inc

Probability and Statistics for Engineering and th…
Statistics
ISBN:
9781305251809
Author:
Jay L. Devore
Publisher:
Cengage Learning

Statistics for The Behavioral Sciences (MindTap C…
Statistics
ISBN:
9781305504912
Author:
Frederick J Gravetter, Larry B. Wallnau
Publisher:
Cengage Learning
MATLAB: An Introduction with Applications
Statistics
ISBN:
9781119256830
Author:
Amos Gilat
Publisher:
John Wiley & Sons Inc
Probability and Statistics for Engineering and th…
Statistics
ISBN:
9781305251809
Author:
Jay L. Devore
Publisher:
Cengage Learning
Statistics for The Behavioral Sciences (MindTap C…
Statistics
ISBN:
9781305504912
Author:
Frederick J Gravetter, Larry B. Wallnau
Publisher:
Cengage Learning

Elementary Statistics: Picturing the World (7th E…
Statistics
ISBN:
9780134683416
Author:
Ron Larson, Betsy Farber
Publisher:
PEARSON

The Basic Practice of Statistics
Statistics
ISBN:
9781319042578
Author:
David S. Moore, William I. Notz, Michael A. Fligner
Publisher:
W. H. Freeman

Introduction to the Practice of Statistics
Statistics
ISBN:
9781319013387
Author:
David S. Moore, George P. McCabe, Bruce A. Craig
Publisher:
W. H. Freeman