What is the most appropriate test to determine if the three feed additives resulted to different mean cortisol level of chickens at 5% level of significance? Justify your answer. T.
What is the most appropriate test to determine if the three feed additives resulted to different mean cortisol level of chickens at 5% level of significance? Justify your answer. T.

MATLAB: An Introduction with Applications
6th Edition
ISBN:9781119256830
Author:Amos Gilat
Publisher:Amos Gilat
Chapter1: Starting With Matlab
Section: Chapter Questions
Problem 1P

Related questions
Question
Answer letter a, use image two as a guide to determine the test to be use and provide justification
Transcribed Image Text:1. CHICKEN FEED ADDITIVE STUDY
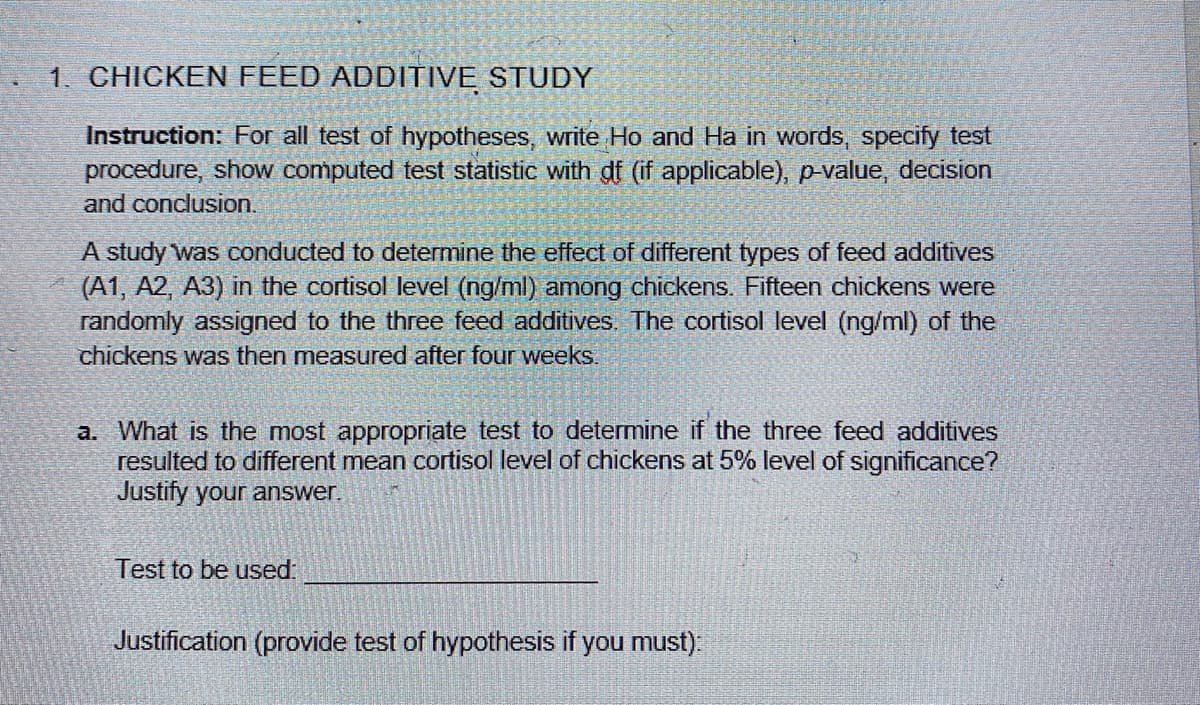
Instruction: For all test of hypotheses, write Ho and Ha in words, specify test
procedure, show computed test statistic with gf (if applicable), p-value, decision
and conclusion.
A study was conducted to determine the effect of different types of feed additives
(A1, A2, A3) in the cortisol level (ng/ml) among chickens. Fifteen chickens were
randomly assigned to the three feed additives. The cortisol level (ng/ml) of the
chickens was then measured after four weeks.
a. What is the most appropriate test to determine if the three feed additives
resulted to different mean cortisol level of chickens at 5% level of significance?
Justify your answer.
Test to be used:
Justification (provide test of hypothesis if you must):
Transcribed Image Text:1. CHICKEN FEED ADDITIVE STUDY
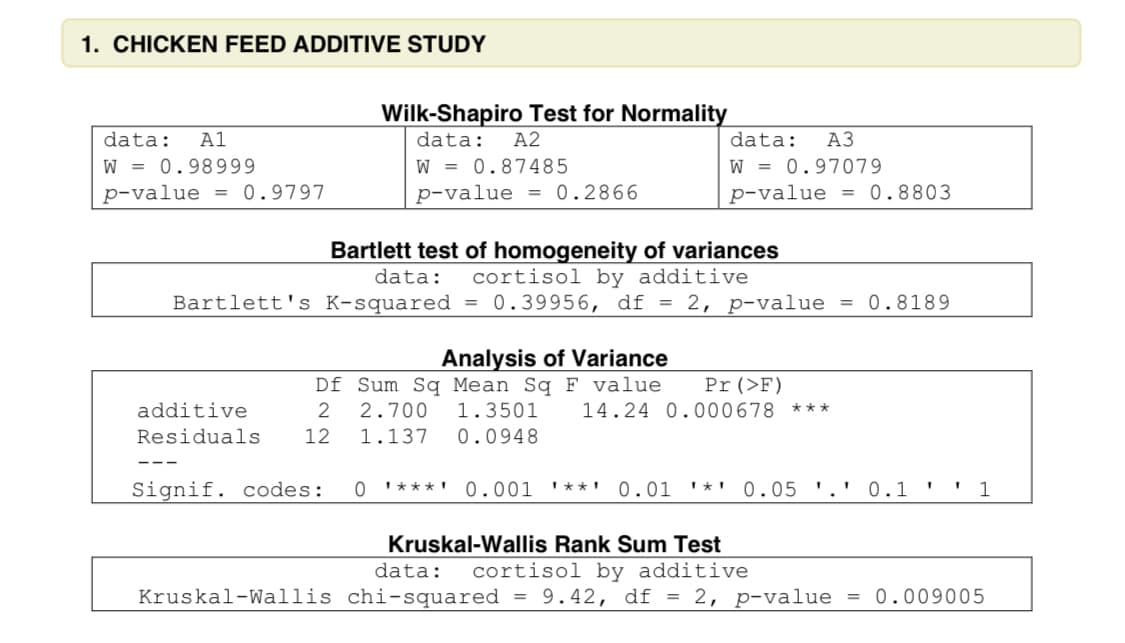
Wilk-Shapiro Test for Normality
data:
A1
data:
A2
data:
АЗ
W = 0.98999
W = 0.87485
p-value = 0.2866
W = 0.97079
p-value = 0.9797
p-value = 0.8803
Bartlett test of homogeneity of variances
cortisol by additive
= 0.39956, df = 2, p-value
data:
Bartlett's K-squared
= 0.8189
Analysis of Variance
Pr(>F)
Df Sum Sq Mean Sq F value
2.700
additive
1.3501
14.24 0.000678 ***
Residuals
12
1.137
0.0948
Signif. codes:
0 '*** ! 0.001 '** !
0.01 '*' 0.05 '.' 0.1 ' ' 1
Kruskal-Wallis Rank Sum Test
data:
cortisol by additive
Kruskal-Wallis chi-squared
9.42, df = 2, p-value = 0.009005
Expert Solution
This question has been solved!
Explore an expertly crafted, step-by-step solution for a thorough understanding of key concepts.

Step by step
Solved in 2 steps

Recommended textbooks for you
MATLAB: An Introduction with Applications
Statistics
ISBN:
9781119256830
Author:
Amos Gilat
Publisher:
John Wiley & Sons Inc

Probability and Statistics for Engineering and th…
Statistics
ISBN:
9781305251809
Author:
Jay L. Devore
Publisher:
Cengage Learning

Statistics for The Behavioral Sciences (MindTap C…
Statistics
ISBN:
9781305504912
Author:
Frederick J Gravetter, Larry B. Wallnau
Publisher:
Cengage Learning
MATLAB: An Introduction with Applications
Statistics
ISBN:
9781119256830
Author:
Amos Gilat
Publisher:
John Wiley & Sons Inc
Probability and Statistics for Engineering and th…
Statistics
ISBN:
9781305251809
Author:
Jay L. Devore
Publisher:
Cengage Learning
Statistics for The Behavioral Sciences (MindTap C…
Statistics
ISBN:
9781305504912
Author:
Frederick J Gravetter, Larry B. Wallnau
Publisher:
Cengage Learning

Elementary Statistics: Picturing the World (7th E…
Statistics
ISBN:
9780134683416
Author:
Ron Larson, Betsy Farber
Publisher:
PEARSON

The Basic Practice of Statistics
Statistics
ISBN:
9781319042578
Author:
David S. Moore, William I. Notz, Michael A. Fligner
Publisher:
W. H. Freeman

Introduction to the Practice of Statistics
Statistics
ISBN:
9781319013387
Author:
David S. Moore, George P. McCabe, Bruce A. Craig
Publisher:
W. H. Freeman