What is the value of the y-intercept of the least-squares regression line for these data? Round your answer to at least two decimal places. (b) What is the value of the sample correlation coefficient for these data? Round your answer to at least three decimal places.
What is the value of the y-intercept of the least-squares regression line for these data? Round your answer to at least two decimal places. (b) What is the value of the sample correlation coefficient for these data? Round your answer to at least three decimal places.

Glencoe Algebra 1, Student Edition, 9780079039897, 0079039898, 2018
18th Edition
ISBN:9780079039897
Author:Carter
Publisher:Carter
Chapter10: Statistics
Section10.5: Comparing Sets Of Data
Problem 13PPS

Related questions
Question
urgent help plee
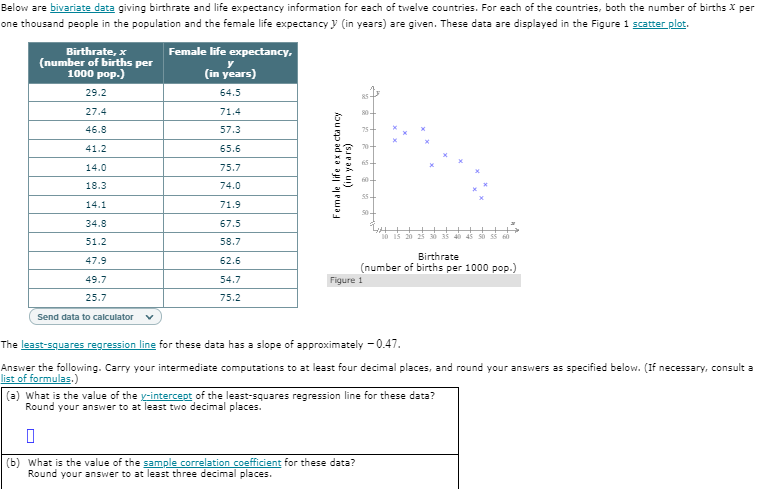
Transcribed Image Text:Below are bivariate data giving birthrate and life expectancy information for each of twelve countries. For each of the countries, both the number of births X per
one thousand people in the population and the female life expectancy y (in years) are given. These data are displayed in the Figure 1 scatter plot.
Birthrate, x
(number of births per
1000 pop.)
Female life expectancy,
y
(in years)
29.2
64.5
27.4
71.4
46.8
57.3
41.2
65.6
70-
65-
14.0
75.7
60-
18.3
74.0
55-
14.1
71.9
34.8
67.5
51.2
58.7
Birthrate
(number of births per 1000 pop.)
47.9
62.6
49.7
54.7
Figure 1
25.7
75.2
Send data to calculator
The least-squares regression line for these data has a slope of approximately - 0.47.
Answer the following. Carry your intermediate computations to at least four decimal places, and round your answers as specified below. (If necessary, consult a
list of formulas.)
(a) What is the value of the y-intercept of the least-squares regression line for these data?
Round your answer to at least two decimal places.
(b) What is the value of the sample correlation coefficient for these data?
Round your answer to at least three decimal places.
(in ye ars)
kou p ad xa a a Pua
Expert Solution
This question has been solved!
Explore an expertly crafted, step-by-step solution for a thorough understanding of key concepts.

This is a popular solution!

Trending now
This is a popular solution!

Step by step
Solved in 2 steps

Recommended textbooks for you
Glencoe Algebra 1, Student Edition, 9780079039897…
Algebra
ISBN:
9780079039897
Author:
Carter
Publisher:
McGraw Hill
Glencoe Algebra 1, Student Edition, 9780079039897…
Algebra
ISBN:
9780079039897
Author:
Carter
Publisher:
McGraw Hill