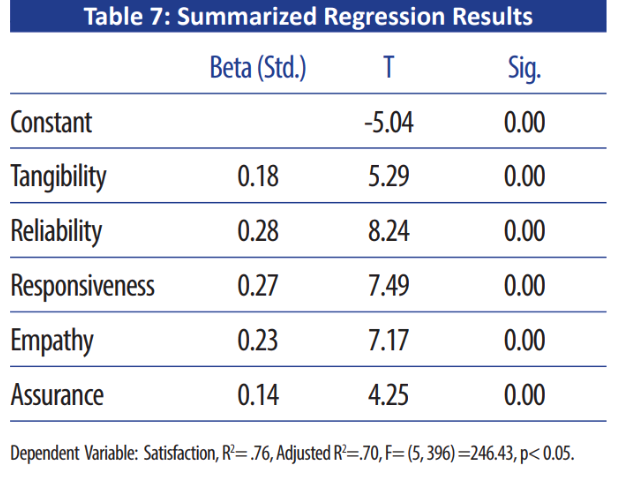
Interpret the results presented in the following table. H1: The predictor variables (i.e. Tangibility, Reliability, Responsiveness, Empathy, and Assurance) have an effect on customer satisfaction H2: Tangibility has a positive impact on customer satisfaction. H3: Reliability has a positive impact on customer satisfaction. H4: Responsiveness has a positive impact on customer satisfaction. H5: Empathy has a positive impact on customer satisfaction. H6: Assurance has a negative impact on customer satisfaction.


Correlation
Correlation defines a relationship between two independent variables. It tells the degree to which variables move in relation to each other. When two sets of data are related to each other, there is a correlation between them.
Linear Correlation
A correlation is used to determine the relationships between numerical and categorical variables. In other words, it is an indicator of how things are connected to one another. The correlation analysis is the study of how variables are related.
Regression Analysis
Regression analysis is a statistical method in which it estimates the relationship between a dependent variable and one or more independent variable. In simple terms dependent variable is called as outcome variable and independent variable is called as predictors. Regression analysis is one of the methods to find the trends in data. The independent variable used in Regression analysis is named Predictor variable. It offers data of an associated dependent variable regarding a particular outcome.
Interpret the results presented in the following table.
H1: The predictor variables (i.e. Tangibility, Reliability, Responsiveness, Empathy, and Assurance) have an effect on customer satisfaction
H2: Tangibility has a positive impact on customer satisfaction.
H3: Reliability has a positive impact on customer satisfaction.
H4: Responsiveness has a positive impact on customer satisfaction.
H5: Empathy has a positive impact on customer satisfaction.
H6: Assurance has a negative impact on customer satisfaction.

Step by step
Solved in 3 steps with 1 images


