What was the first consideration in the decision process behind the psychologist selecting an independent samples t test to test their hypothesis? Select one: O a. deciding between a paired or independent samples analysis if samples are independent? O b. deciding between single or independent samples if using a control group? O c. deciding between a z or t test if we don't know the population standard deviation? O d. deciding between paired or independent samples if using a control group?
What was the first consideration in the decision process behind the psychologist selecting an independent samples t test to test their hypothesis? Select one: O a. deciding between a paired or independent samples analysis if samples are independent? O b. deciding between single or independent samples if using a control group? O c. deciding between a z or t test if we don't know the population standard deviation? O d. deciding between paired or independent samples if using a control group?

Glencoe Algebra 1, Student Edition, 9780079039897, 0079039898, 2018
18th Edition
ISBN:9780079039897
Author:Carter
Publisher:Carter
Chapter4: Equations Of Linear Functions
Section4.5: Correlation And Causation
Problem 2AGP

Related questions
Question
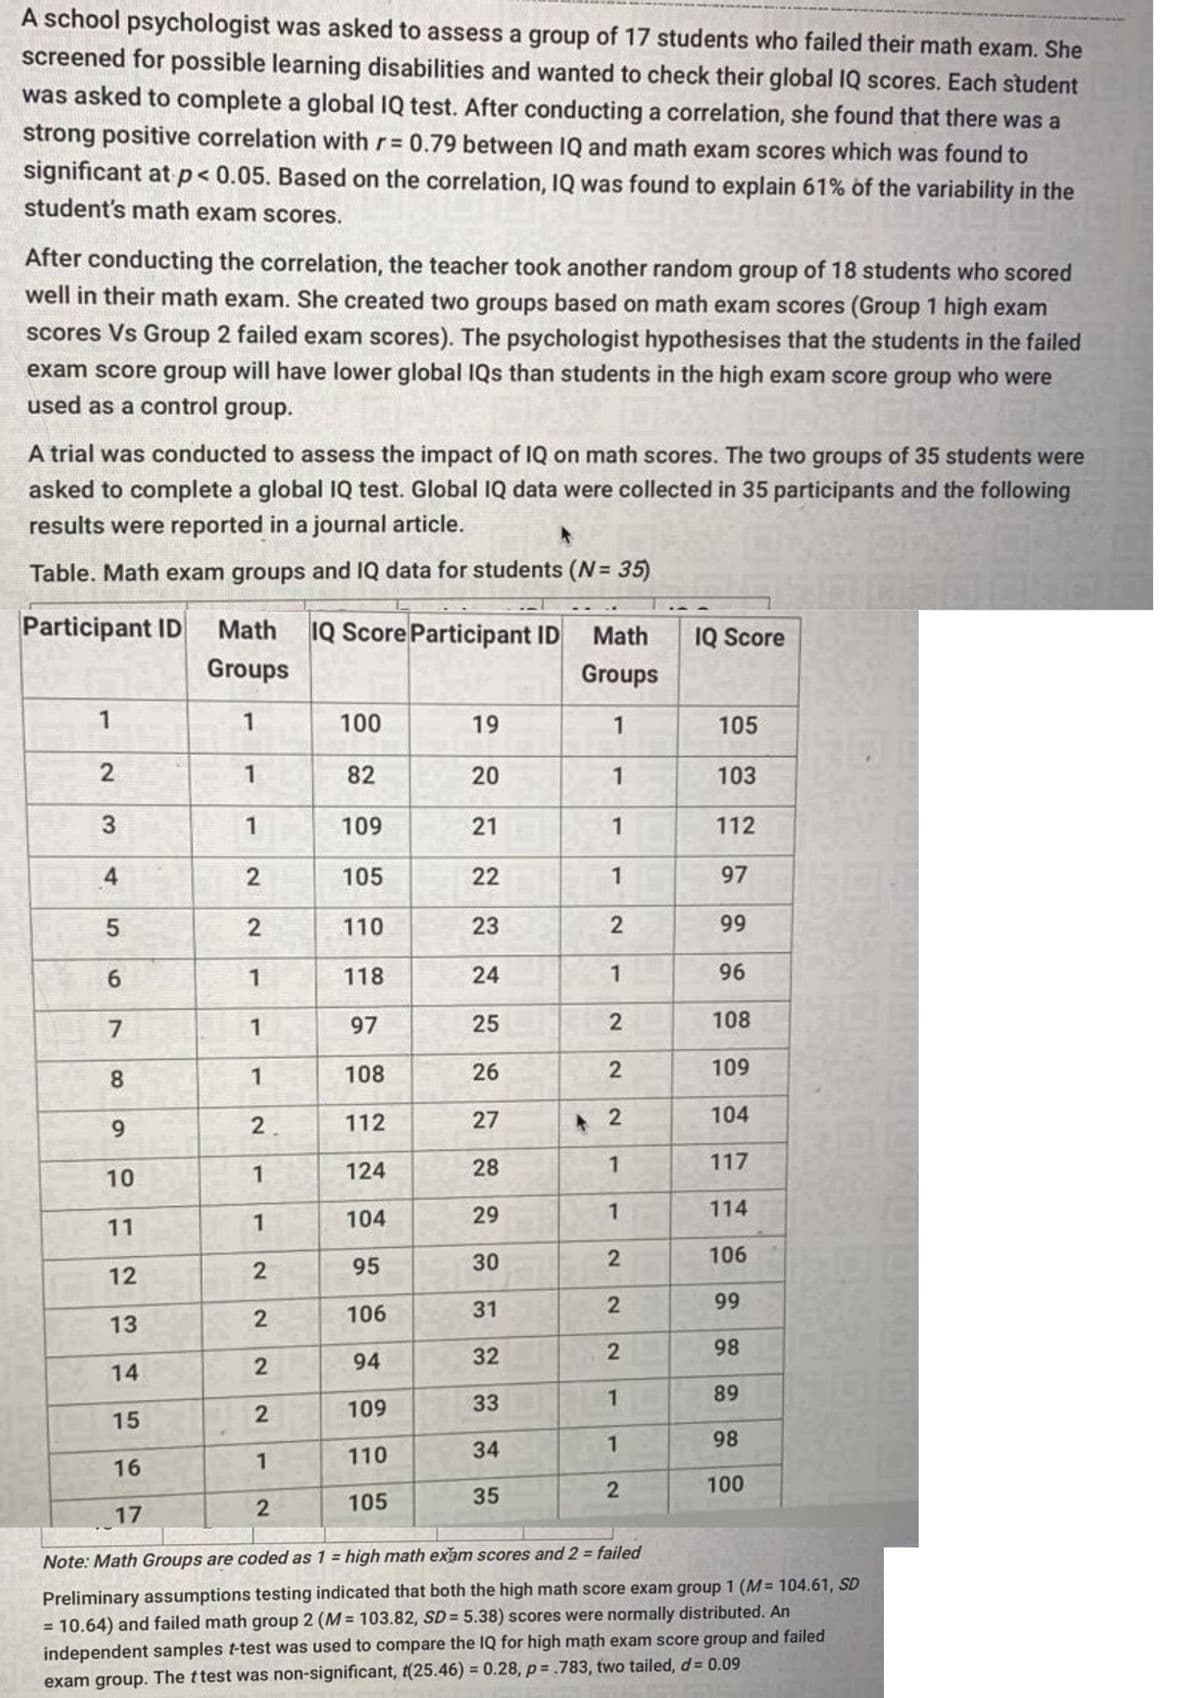
Transcribed Image Text:A school psychologist was asked to assess a group of 17 students who failed their math exam. She
screened for possible learning disabilities and wanted to check their global IQ scores. Each student
was asked to complete a global IQ test. After conducting a correlation, she found that there was a
strong positive correlation with r= 0.79 between IQ and math exam scores which was found to
significant at p < 0.05. Based on the correlation, IQ was found to explain 61% of the variability in the
student's math exam scores.
After conducting the correlation, the teacher took another random group of 18 students who scored
well in their math exam. She created two groups based on math exam scores (Group 1 high exam
scores Vs Group 2 failed exam scores). The psychologist hypothesises that the students in the failed
exam score group will have lower global IQs than students in the high exam score group who were
used as a control group.
A trial was conducted to assess the impact of IQ on math scores. The two groups of 35 students were
asked to complete a global IQ test. Global IQ data were collected in 35 participants and the following
results were reported in a journal article.
Table. Math exam groups and IQ data for students (N= 35)
Participant ID
Math
IQ Score Participant ID
Math
IQ Score
Groups
Groups
1
100
19
1
105
82
20
1
103
3
1
109
21
1
112
4
2
105
22
1
97
5.
2
110
23
2
99
1
118
24
96
7
1
97
25
108
8.
108
26
109
6.
2.
112
27
104
1
124
28
117
10
1
104
29
1
114
11
95
30
2
106
12
106
31
99
13
98
94
32
14
89
2
109
33
15
98
110
34
16
1
100
105
35
17
Note: Math Groups are coded as 1 = high math exam scores and 2 = failed
Preliminary assumptions testing indicated that both the high math score exam group 1 (M= 104.61, SD
= 10.64) and failed math group 2 (M = 103.82, SD = 5.38) scores were normally distributed. An
independent samples t-test was used to compare the IQ for high math exam score group and failed
exam group. The ttest was non-significant, t(25.46) = 0.28, p=.783, two tailed, d= 0.09
2.
2.
2)
21
2.
2)
2)
2.
6o
Transcribed Image Text:What was the first consideration in the decision process behind the psychologist selecting an
independent samples t test to test their hypothesis?
Select one:
O a. deciding between a paired or independent samples analysis if samples are independent?
O b. deciding between single or independent samples if using a control group?
O c. deciding between a z or t test if we don't know the population standard deviation?
O d. deciding between paired or independent samples if using a control group?
Expert Solution
This question has been solved!
Explore an expertly crafted, step-by-step solution for a thorough understanding of key concepts.

This is a popular solution!

Trending now
This is a popular solution!

Step by step
Solved in 2 steps with 1 images

Recommended textbooks for you
Glencoe Algebra 1, Student Edition, 9780079039897…
Algebra
ISBN:
9780079039897
Author:
Carter
Publisher:
McGraw Hill

Big Ideas Math A Bridge To Success Algebra 1: Stu…
Algebra
ISBN:
9781680331141
Author:
HOUGHTON MIFFLIN HARCOURT
Publisher:
Houghton Mifflin Harcourt
Glencoe Algebra 1, Student Edition, 9780079039897…
Algebra
ISBN:
9780079039897
Author:
Carter
Publisher:
McGraw Hill
Big Ideas Math A Bridge To Success Algebra 1: Stu…
Algebra
ISBN:
9781680331141
Author:
HOUGHTON MIFFLIN HARCOURT
Publisher:
Houghton Mifflin Harcourt