When the districts were divided into districts with small classes (<20 students per teacher) and large classes (2 20 students per teacher), the following results were found: Class Size Average Score (Y) Standard Deviation (sy) Small 644.3 19.0 228 Large 637.0 17.5 185 Is there statistically significant evidence that the districts with smaller classes have higher average test scores? The t-statistic for testing the null hypothesis is 4.06 . (Round your response to two decimal places.) The p-value for the test is|. (Round your response to six decimal places.) Hint: Use the Excel function Norm.S.Dist to help answer this question.
When the districts were divided into districts with small classes (<20 students per teacher) and large classes (2 20 students per teacher), the following results were found: Class Size Average Score (Y) Standard Deviation (sy) Small 644.3 19.0 228 Large 637.0 17.5 185 Is there statistically significant evidence that the districts with smaller classes have higher average test scores? The t-statistic for testing the null hypothesis is 4.06 . (Round your response to two decimal places.) The p-value for the test is|. (Round your response to six decimal places.) Hint: Use the Excel function Norm.S.Dist to help answer this question.

MATLAB: An Introduction with Applications
6th Edition
ISBN:9781119256830
Author:Amos Gilat
Publisher:Amos Gilat
Chapter1: Starting With Matlab
Section: Chapter Questions
Problem 1P

Related questions
Question
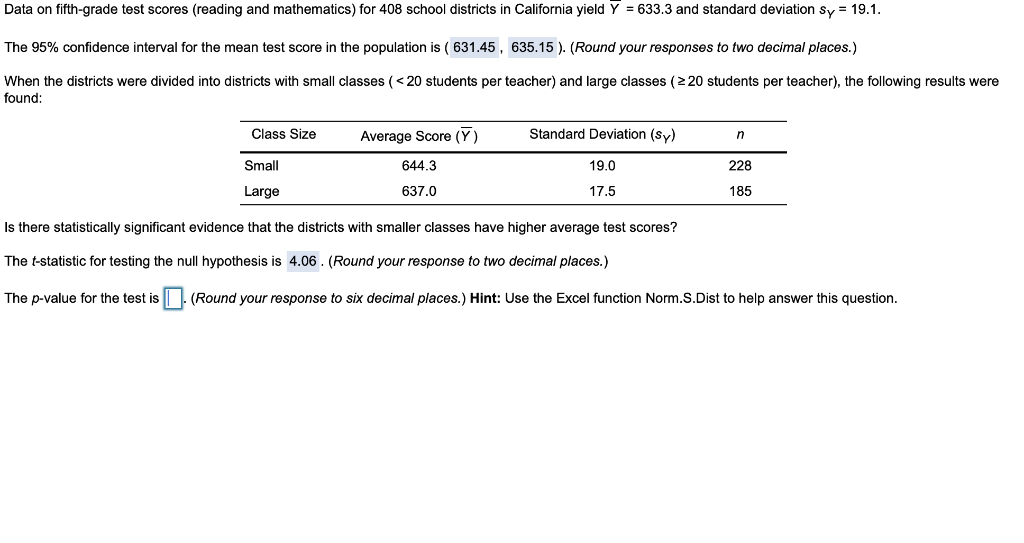
Transcribed Image Text:Data on fifth-grade test scores (reading and mathematics) for 408 school districts in California yield Y = 633.3 and standard deviation sy = 19.1.
The 95% confidence interval for the mean test score in the population is ( 631.45, 635.15 ). (Round your responses to two decimal places.)
When the districts were divided into districts with small classes (< 20 students per teacher) and large classes (2 20 students per teacher), the following results were
found:
Class Size
Average Score (Y)
Standard Deviation (sy)
Small
644.3
19.0
228
Large
637.0
17.5
185
Is there statistically significant evidence that the districts with smaller classes have higher average test scores?
The t-statistic for testing the null hypothesis is 4.06. (Round your response to two decimal places.)
The p-value for the test is|. (Round your response to six decimal places.) Hint: Use the Excel function Norm.S.Dist to help answer this question.
Expert Solution
This question has been solved!
Explore an expertly crafted, step-by-step solution for a thorough understanding of key concepts.

This is a popular solution!

Trending now
This is a popular solution!

Step by step
Solved in 2 steps with 2 images

Recommended textbooks for you
MATLAB: An Introduction with Applications
Statistics
ISBN:
9781119256830
Author:
Amos Gilat
Publisher:
John Wiley & Sons Inc

Probability and Statistics for Engineering and th…
Statistics
ISBN:
9781305251809
Author:
Jay L. Devore
Publisher:
Cengage Learning

Statistics for The Behavioral Sciences (MindTap C…
Statistics
ISBN:
9781305504912
Author:
Frederick J Gravetter, Larry B. Wallnau
Publisher:
Cengage Learning
MATLAB: An Introduction with Applications
Statistics
ISBN:
9781119256830
Author:
Amos Gilat
Publisher:
John Wiley & Sons Inc
Probability and Statistics for Engineering and th…
Statistics
ISBN:
9781305251809
Author:
Jay L. Devore
Publisher:
Cengage Learning
Statistics for The Behavioral Sciences (MindTap C…
Statistics
ISBN:
9781305504912
Author:
Frederick J Gravetter, Larry B. Wallnau
Publisher:
Cengage Learning

Elementary Statistics: Picturing the World (7th E…
Statistics
ISBN:
9780134683416
Author:
Ron Larson, Betsy Farber
Publisher:
PEARSON

The Basic Practice of Statistics
Statistics
ISBN:
9781319042578
Author:
David S. Moore, William I. Notz, Michael A. Fligner
Publisher:
W. H. Freeman

Introduction to the Practice of Statistics
Statistics
ISBN:
9781319013387
Author:
David S. Moore, George P. McCabe, Bruce A. Craig
Publisher:
W. H. Freeman