When two variables have a positive correlation, O a. if the x-variable decreases, the y-variable decreases. b. one variable will move while the other remains constant O c. the variables' values are never positive. O d. if the x-variable increases, the y-variable decreases.
When two variables have a positive correlation, O a. if the x-variable decreases, the y-variable decreases. b. one variable will move while the other remains constant O c. the variables' values are never positive. O d. if the x-variable increases, the y-variable decreases.

Chapter4: Utility Maximization And Choice
Section: Chapter Questions
Problem 4.3P

Related questions
Question
i need the answer quickly
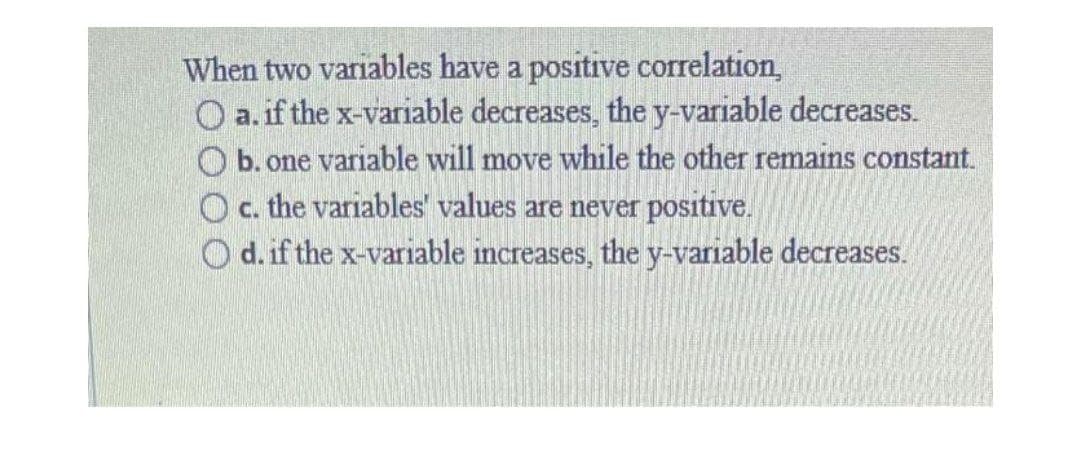
Transcribed Image Text:When two variables have a positive correlation,
O a. if the x-variable decreases, the y-variable decreases.
b. one variable will move while the other remains constant.
O c. the variables' values are never positive.
O d. if the x-variable increases, the y-variable decreases.
Expert Solution
This question has been solved!
Explore an expertly crafted, step-by-step solution for a thorough understanding of key concepts.

This is a popular solution!

Trending now
This is a popular solution!

Step by step
Solved in 2 steps

Recommended textbooks for you


