If the slope of a straight line is -3. and if Y (the variable on the vertical axis) decreases by 6, then X (the variable on the horizontal axis) will O a decrease by 2. O b. increase by 18. increase by 2. Od. decrease by 18.
If the slope of a straight line is -3. and if Y (the variable on the vertical axis) decreases by 6, then X (the variable on the horizontal axis) will O a decrease by 2. O b. increase by 18. increase by 2. Od. decrease by 18.

Chapter1: Introducing The Economic Way Of Thinking
Section1.A: Applying Graphs To Economics
Problem 12SQ

Related questions
Question
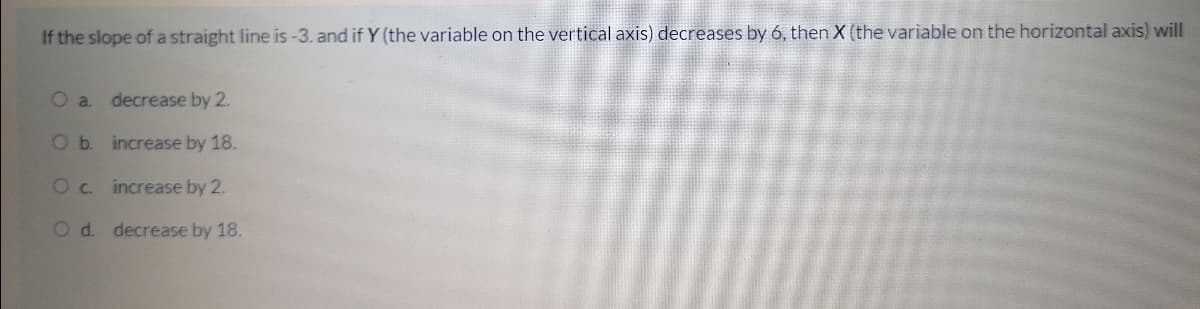
Transcribed Image Text:If the slope of a straight line is -3. and if Y (the variable on the vertical axis) decreases by 6, then X (the variable on the horizontal axis) will
Oa.
decrease by 2.
O b. increase by 18.
Oc increase by 2.
O d. decrease by 18.
Expert Solution
This question has been solved!
Explore an expertly crafted, step-by-step solution for a thorough understanding of key concepts.

This is a popular solution!

Trending now
This is a popular solution!

Step by step
Solved in 2 steps with 2 images

Recommended textbooks for you


Economics (MindTap Course List)
Economics
ISBN:
9781337617383
Author:
Roger A. Arnold
Publisher:
Cengage Learning