(b) Rank the three economic variables from most important to least important. Provide one relevant reason to justify your selection for each of the three positions. (I.e. a reason why each variable is placed at position 1, 2 and 3.) Rank Variable Justification 1 3
(b) Rank the three economic variables from most important to least important. Provide one relevant reason to justify your selection for each of the three positions. (I.e. a reason why each variable is placed at position 1, 2 and 3.) Rank Variable Justification 1 3

Chapter1: Making Economics Decisions
Section: Chapter Questions
Problem 1QTC

Related questions
Question
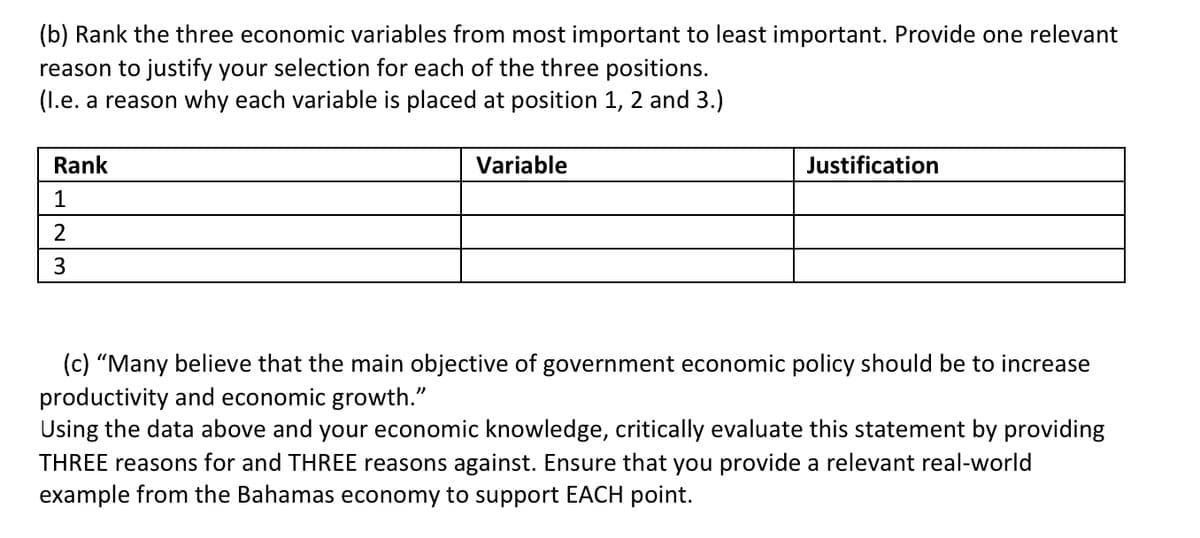
Transcribed Image Text:(b) Rank the three economic variables from most important to least important. Provide one relevant
reason to justify your selection for each of the three positions.
(I.e. a reason why each variable is placed at position 1, 2 and 3.)
Rank
Variable
Justification
1
2
3.
(c) “Many believe that the main objective of government economic policy should be to increase
productivity and economic growth."
Using the data above and your economic knowledge, critically evaluate this statement by providing
THREE reasons for and THREE reasons against. Ensure that you provide a relevant real-world
example from the Bahamas economy to support EACH point.
Expert Solution
This question has been solved!
Explore an expertly crafted, step-by-step solution for a thorough understanding of key concepts.

Step by step
Solved in 3 steps

Knowledge Booster


Learn more about
Need a deep-dive on the concept behind this application? Look no further. Learn more about this topic, economics and related others by exploring similar questions and additional content below.Recommended textbooks for you

Principles of Economics (12th Edition)
Economics
ISBN:
9780134078779
Author:
Karl E. Case, Ray C. Fair, Sharon E. Oster
Publisher:
PEARSON

Engineering Economy (17th Edition)
Economics
ISBN:
9780134870069
Author:
William G. Sullivan, Elin M. Wicks, C. Patrick Koelling
Publisher:
PEARSON
Principles of Economics (12th Edition)
Economics
ISBN:
9780134078779
Author:
Karl E. Case, Ray C. Fair, Sharon E. Oster
Publisher:
PEARSON
Engineering Economy (17th Edition)
Economics
ISBN:
9780134870069
Author:
William G. Sullivan, Elin M. Wicks, C. Patrick Koelling
Publisher:
PEARSON

Principles of Economics (MindTap Course List)
Economics
ISBN:
9781305585126
Author:
N. Gregory Mankiw
Publisher:
Cengage Learning

Managerial Economics: A Problem Solving Approach
Economics
ISBN:
9781337106665
Author:
Luke M. Froeb, Brian T. McCann, Michael R. Ward, Mike Shor
Publisher:
Cengage Learning

Managerial Economics & Business Strategy (Mcgraw-…
Economics
ISBN:
9781259290619
Author:
Michael Baye, Jeff Prince
Publisher:
McGraw-Hill Education