Which amongst the following is a property of a good measure of dispersion? Select one: a. Simple to understand and easy to compute b. Rigidly defined c. all of these d. Based on each individual item of the distribution
Which amongst the following is a property of a good measure of dispersion? Select one: a. Simple to understand and easy to compute b. Rigidly defined c. all of these d. Based on each individual item of the distribution

Glencoe Algebra 1, Student Edition, 9780079039897, 0079039898, 2018
18th Edition
ISBN:9780079039897
Author:Carter
Publisher:Carter
Chapter10: Statistics
Section10.4: Distributions Of Data
Problem 19PFA

Related questions
Question
Q4
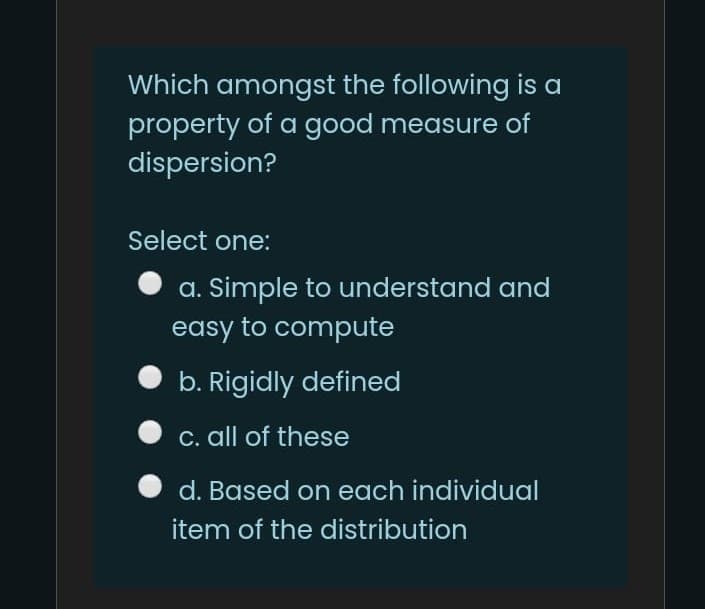
Transcribed Image Text:Which amongst the following is a
property of a good measure of
dispersion?
Select one:
a. Simple to understand and
easy to compute
b. Rigidly defined
C. all of these
d. Based on each individual
item of the distribution
Expert Solution
This question has been solved!
Explore an expertly crafted, step-by-step solution for a thorough understanding of key concepts.

Step by step
Solved in 2 steps

Recommended textbooks for you
Glencoe Algebra 1, Student Edition, 9780079039897…
Algebra
ISBN:
9780079039897
Author:
Carter
Publisher:
McGraw Hill
Glencoe Algebra 1, Student Edition, 9780079039897…
Algebra
ISBN:
9780079039897
Author:
Carter
Publisher:
McGraw Hill