
Introductory Chemistry: An Active Learning Approach
6th Edition
ISBN:9781305079250
Author:Mark S. Cracolice, Ed Peters
Publisher:Mark S. Cracolice, Ed Peters
Chapter16: Solutions
Section: Chapter Questions
Problem 44E: You need to make an aqueous solution of 0.123M manganese (II) acetate acetate ion, C2H3O2 for an...

Related questions
Question
Which graph best represents the titration of ammonia with hydrochloric acid?
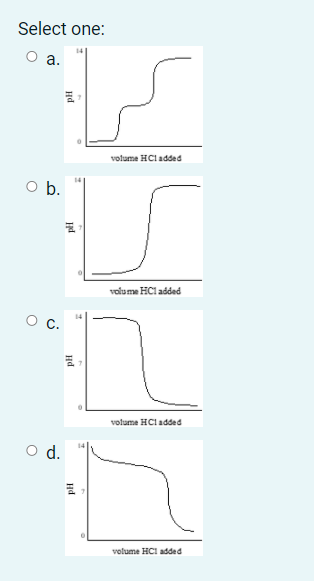
Transcribed Image Text:Select one:
а.
volume HCladded
Ob.
volume HCl added
volume HCladded
d.
volume HCI added
Hd
Hd
Expert Solution
This question has been solved!
Explore an expertly crafted, step-by-step solution for a thorough understanding of key concepts.

This is a popular solution!

Trending now
This is a popular solution!

Step by step
Solved in 2 steps with 1 images

Knowledge Booster


Learn more about
Need a deep-dive on the concept behind this application? Look no further. Learn more about this topic, chemistry and related others by exploring similar questions and additional content below.Recommended textbooks for you
Introductory Chemistry: An Active Learning Approa…
Chemistry
ISBN:
9781305079250
Author:
Mark S. Cracolice, Ed Peters
Publisher:
Cengage Learning

World of Chemistry, 3rd edition
Chemistry
ISBN:
9781133109655
Author:
Steven S. Zumdahl, Susan L. Zumdahl, Donald J. DeCoste
Publisher:
Brooks / Cole / Cengage Learning
Introductory Chemistry: An Active Learning Approa…
Chemistry
ISBN:
9781305079250
Author:
Mark S. Cracolice, Ed Peters
Publisher:
Cengage Learning
World of Chemistry, 3rd edition
Chemistry
ISBN:
9781133109655
Author:
Steven S. Zumdahl, Susan L. Zumdahl, Donald J. DeCoste
Publisher:
Brooks / Cole / Cengage Learning