Which is the correct output (B or C) for the appropriate test? Explain.

Glencoe Algebra 1, Student Edition, 9780079039897, 0079039898, 2018
18th Edition
ISBN:9780079039897
Author:Carter
Publisher:Carter
Chapter10: Statistics
Section10.3: Measures Of Spread
Problem 1GP

Related questions

Topic Video
Question
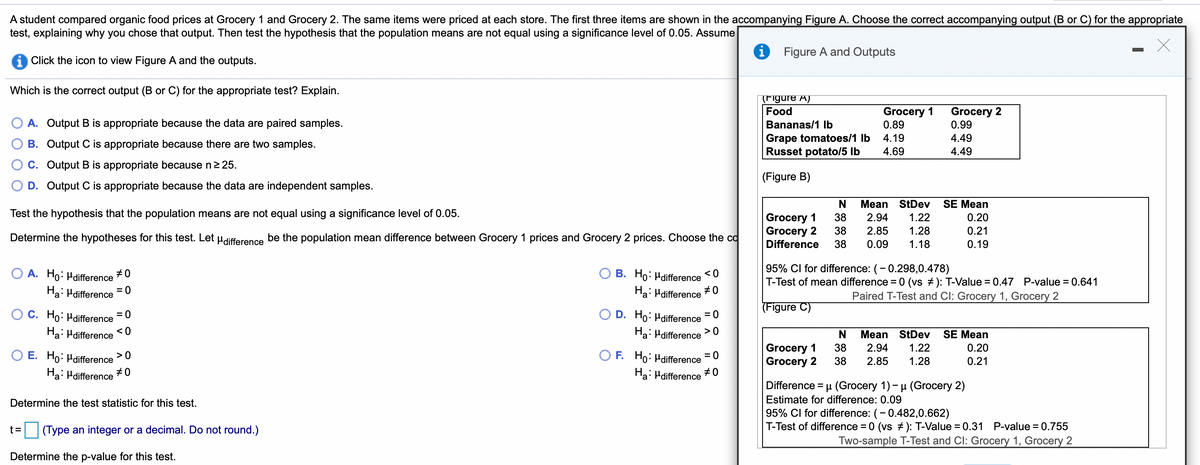
Transcribed Image Text:A student compared organic food prices at Grocery 1 and Grocery 2. The same items were priced at each store. The first three items are shown in the accompanying Figure A. Choose the correct accompanying output (B or C) for the appropriate
test, explaining why you chose that output. Then test the hypothesis that the population means are not equal using a significance level of 0.05. Assume
i Figure A and Outputs
Click the icon to view Figure A and the outputs.
Which is the correct output (B or C) for the appropriate test? Explain.
(Figure A)
Food
Grocery 1
0.89
Grocery 2
0.99
A. Output B is appropriate because the data are paired samples.
Bananas/1 Ib
Grape tomatoes/1 Ib
Russet potato/5 Ib
4.19
4.49
B. Output C is appropriate because there are two samples.
4.69
4.49
C. Output B is appropriate because n2 25.
(Figure B)
D. Output C is appropriate because the data are independent samples.
N
Mean StDev
SE Mean
Test the hypothesis that the population means are not equal using a significance level of 0.05.
Grocery 1
Grocery 2
Difference
38
2.94
1.22
0.20
38
2.85
1.28
0.21
Determine the hypotheses for this test. Let Hdifference be the population mean difference between Grocery 1 prices and Grocery 2 prices. Choose the co
38
0.09
1.18
0.19
95% Cl for difference: (-0.298,0.478)
T-Test of mean difference =0 (vs +): T-Value = 0.47 P-value = 0.641
B. Ho: Hdifference
< 0
A. Ho: Hdifference +0
Ha: Hdifference
= 0
Ha: Hdifference
#0
Paired T-Test and Cl: Grocery 1, Grocery 2
(Figure C)
C. Ho: Hdifference
= 0
D. Ho: Hdifference
= 0
Ha: Hdifference
<0
Ha: Hdifference
>0
N
Mean
StDev
SE Mean
Grocery 1
Grocery 2
38
2.94
1.22
0.20
E. Ho: Hdifference
Ha: Hdifference
>0
F. Ho: Hdifference =0
Ha: Hdifference
38
2.85
1.28
0.21
+0
#0
Difference = u (Grocery 1) -µ (Grocery 2)
Determine the test statistic for this test.
Estimate for difference: 0.09
95% Cl for difference: (- 0.482,0.662)
t=
(Type an integer or a decimal. Do not round.)
T-Test of difference = 0 (vs +): T-Value = 0.31 P-value = 0.755
Two-sample T-Test and Cl: Grocery 1, Grocery 2
Determine the p-value for this test.
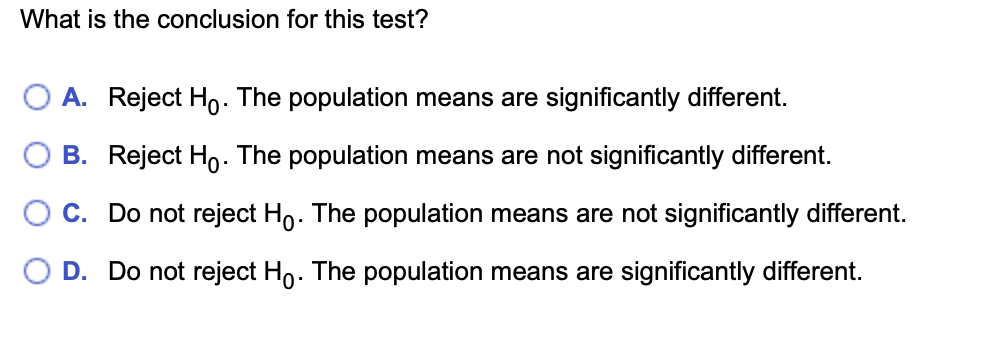
Transcribed Image Text:What is the conclusion for this test?
A. Reject Ho. The population means are significantly different.
O B. Reject Họ. The population means are not significantly different.
C. Do not reject Ho. The population means are not significantly different.
O D. Do not reject Ho. The population means are significantly different.
Expert Solution
This question has been solved!
Explore an expertly crafted, step-by-step solution for a thorough understanding of key concepts.

This is a popular solution!

Trending now
This is a popular solution!

Step by step
Solved in 2 steps

Knowledge Booster


Learn more about
Need a deep-dive on the concept behind this application? Look no further. Learn more about this topic, statistics and related others by exploring similar questions and additional content below.Recommended textbooks for you
Glencoe Algebra 1, Student Edition, 9780079039897…
Algebra
ISBN:
9780079039897
Author:
Carter
Publisher:
McGraw Hill

College Algebra (MindTap Course List)
Algebra
ISBN:
9781305652231
Author:
R. David Gustafson, Jeff Hughes
Publisher:
Cengage Learning
Glencoe Algebra 1, Student Edition, 9780079039897…
Algebra
ISBN:
9780079039897
Author:
Carter
Publisher:
McGraw Hill
College Algebra (MindTap Course List)
Algebra
ISBN:
9781305652231
Author:
R. David Gustafson, Jeff Hughes
Publisher:
Cengage Learning