Which of the following functions can be used in Excel to create a histogram for an output distribution in a Monte Carlo simulation model? O =OUTPUTTABLE) O =POISSON() =FREQUENCY() O =VLOOKUP()
Which of the following functions can be used in Excel to create a histogram for an output distribution in a Monte Carlo simulation model? O =OUTPUTTABLE) O =POISSON() =FREQUENCY() O =VLOOKUP()

Glencoe Algebra 1, Student Edition, 9780079039897, 0079039898, 2018
18th Edition
ISBN:9780079039897
Author:Carter
Publisher:Carter
Chapter10: Statistics
Section10.1: Measures Of Center
Problem 9PPS

Related questions
Question
N2
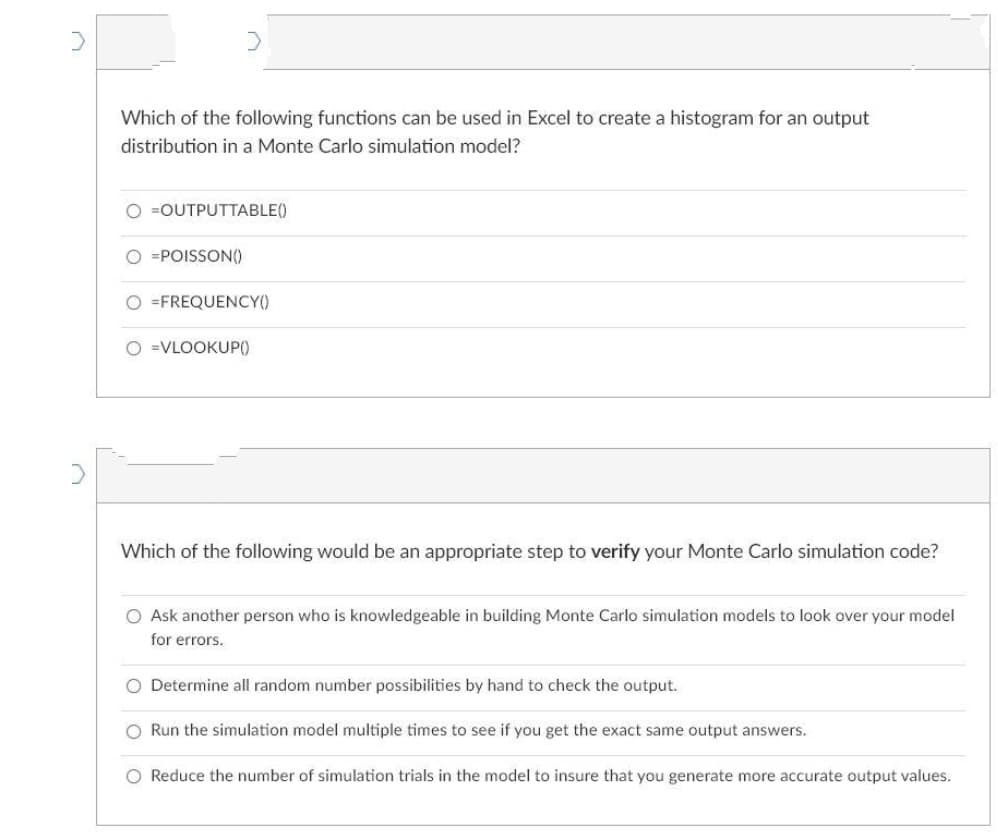
Transcribed Image Text:Which of the following functions can be used in Excel to create a histogram for an output
distribution in a Monte Carlo simulation model?
O =OUTPUTTABLE()
O =POISSON()
O =FREQUENCY()
O =VLOOKUP(0
Which of the following would be an appropriate step to verify your Monte Carlo simulation code?
O Ask another person who is knowledgeable in building Monte Carlo simulation models to look over your model
for errors.
O Determine all random number possibilities by hand to check the output.
O Run the simulation model multiple times to see if you get the exact same output answers.
O Reduce the number of simulation trials in the model to insure that you generate more accurate output values.
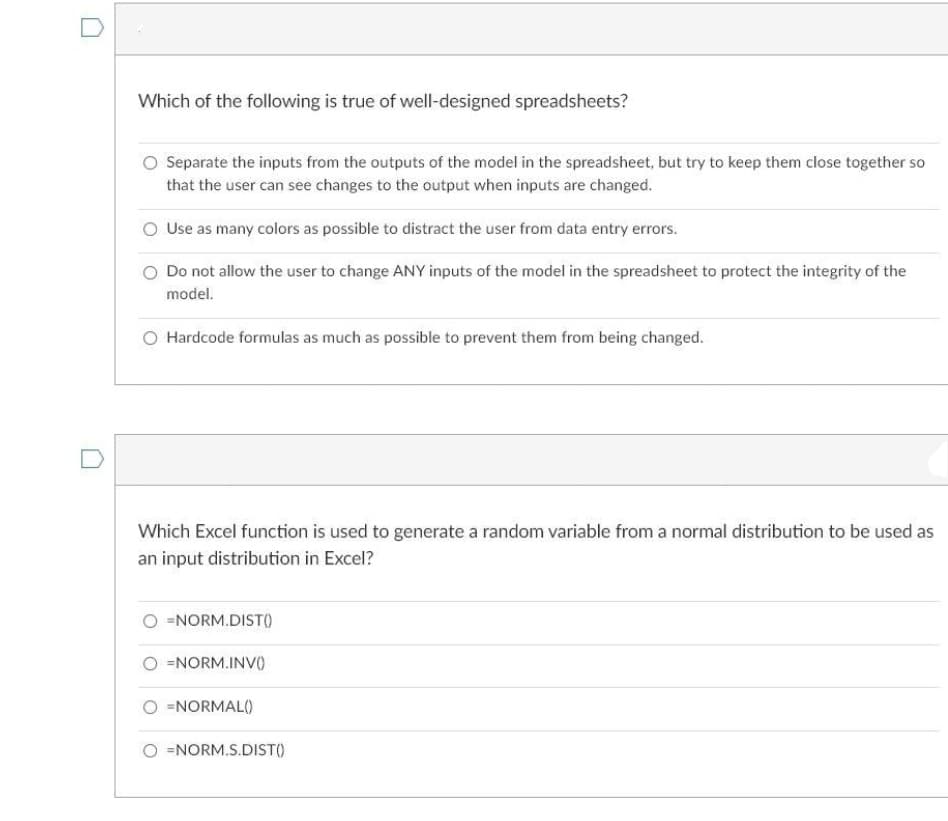
Transcribed Image Text:Which of the following is true of well-designed spreadsheets?
O Separate the inputs from the outputs of the model in the spreadsheet, but try to keep them close together so
that the user can see changes to the output when inputs are changed.
O Use as many colors as possible to distract the user from data entry errors.
O Do not allow the user to change ANY inputs of the model in the spreadsheet to protect the integrity of the
model.
O Hardcode formulas as much as possible to prevent them from being changed.
Which Excel function is used to generate a random variable from a normal distribution to be used as
an input distribution in Excel?
=NORM.DIST()
O =NORM.INVO
O =NORMAL()
O =NORM.S.DIST()
Expert Solution
This question has been solved!
Explore an expertly crafted, step-by-step solution for a thorough understanding of key concepts.

This is a popular solution!

Trending now
This is a popular solution!

Step by step
Solved in 3 steps

Recommended textbooks for you
Glencoe Algebra 1, Student Edition, 9780079039897…
Algebra
ISBN:
9780079039897
Author:
Carter
Publisher:
McGraw Hill
Glencoe Algebra 1, Student Edition, 9780079039897…
Algebra
ISBN:
9780079039897
Author:
Carter
Publisher:
McGraw Hill