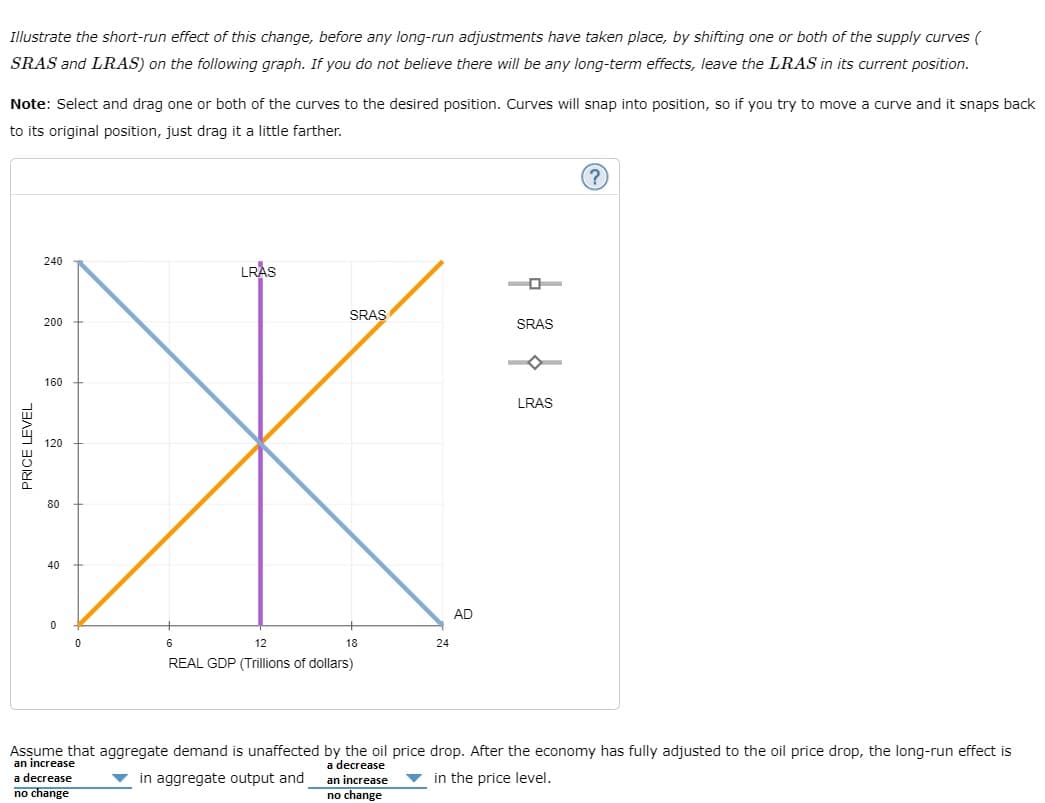
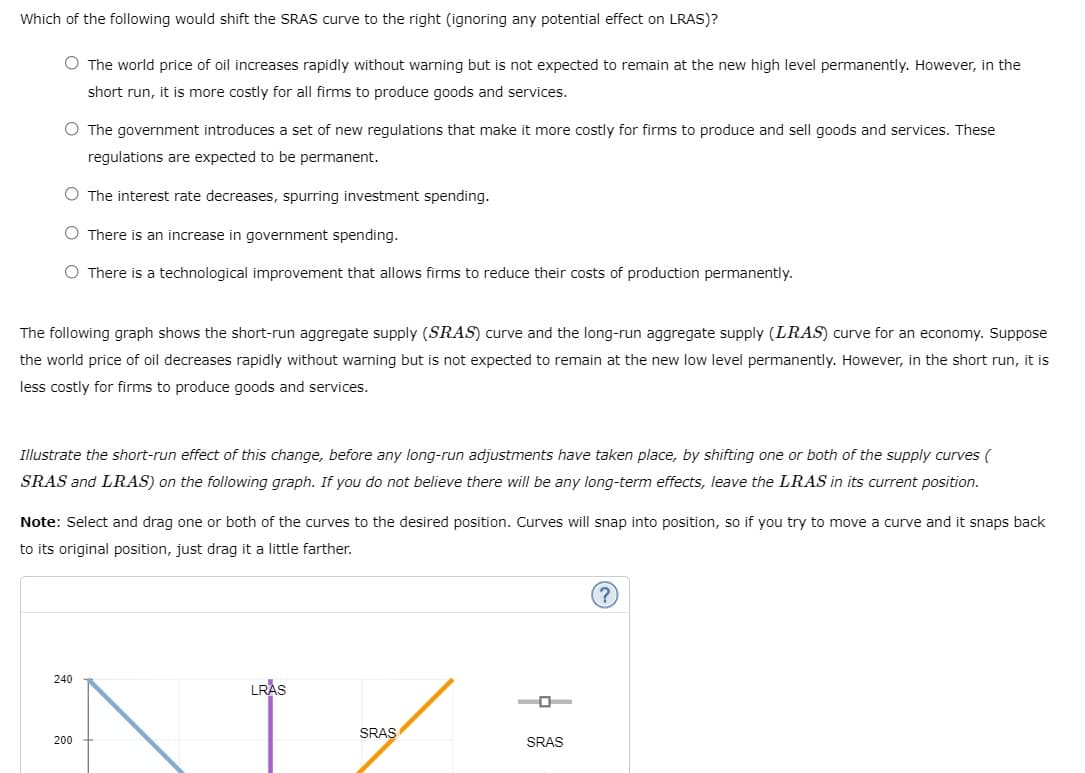
Which of the following would shift the SRAS curve to the right (ignoring any potential effect on LRAS)? O The world price of oil increases rapidly without warning but is not expected to remain at the new high level permanently. However, in the short run, it is more costly for all firms to produce goods and services. O The government introduces a set of new regulations that make more costly for firms to produce and sell goods and services. These regulations are expected to be permanent. O The interest rate decreases, spurring investment spending. O There is an increase in government spending. O There is a technological improvement that allows firms to reduce their costs of production permanently. The following graph shows the short-run aggregate supply (SRAS) curve and the long-run aggregate supply (LRAS) curve for an economy. Suppose the world price of oil decreases rapidly without warning but is not expected to remain at the new low level permanently. However, in the short run, it is less costly for firms to produce goods and services. Illustrate the short-run effect of this change, before any long-run adjustments have taken place, by shifting one or both of the supply curves ( SRAS and LRAS) on the following graph. If you do not believe there will be any long-term effects, leave the LRAS in its current position. Note: Select and drag one or both of the curves to the desired position. Curves will snap into position, so if you try to move a curve and it snaps back to its original position, just drag it a little farther.
Which of the following would shift the SRAS curve to the right (ignoring any potential effect on LRAS)? O The world price of oil increases rapidly without warning but is not expected to remain at the new high level permanently. However, in the short run, it is more costly for all firms to produce goods and services. O The government introduces a set of new regulations that make more costly for firms to produce and sell goods and services. These regulations are expected to be permanent. O The interest rate decreases, spurring investment spending. O There is an increase in government spending. O There is a technological improvement that allows firms to reduce their costs of production permanently. The following graph shows the short-run aggregate supply (SRAS) curve and the long-run aggregate supply (LRAS) curve for an economy. Suppose the world price of oil decreases rapidly without warning but is not expected to remain at the new low level permanently. However, in the short run, it is less costly for firms to produce goods and services. Illustrate the short-run effect of this change, before any long-run adjustments have taken place, by shifting one or both of the supply curves ( SRAS and LRAS) on the following graph. If you do not believe there will be any long-term effects, leave the LRAS in its current position. Note: Select and drag one or both of the curves to the desired position. Curves will snap into position, so if you try to move a curve and it snaps back to its original position, just drag it a little farther.
Chapter10: Aggregate Demand And Supply
Section10.A: The Self Correcting Aggregate Demand And Supply Model
Problem 10SQ
Related questions
Question

Transcribed Image Text:Illustrate the short-run effect of this change, before any long-run adjustments have taken place, by shifting one or both of the supply curves (
SRAS and LRAS) on the following graph. If you do not believe there will be any long-term effects, leave the LRAS in its current position.
Note: Select and drag one or both of the curves to the desired position. Curves will snap into position, so if you try to move a curve and it snaps back
to its original position, just drag it a little farther.
LRAS
SRAS
160
120
*
80
6
12
18
REAL GDP (Trillions of dollars)
PRICE LEVEL
240
200
40
0
0
24
AD
SRAS
LRAS
Assume that aggregate demand is unaffected by the oil price drop. After the economy has fully adjusted to the oil price drop, the long-run effect is
a decrease
an increase
a decrease
in aggregate output and
an increase
in the price level.
no change
no change

Transcribed Image Text:Which of the following would shift the SRAS curve to the right (ignoring any potential effect on LRAS)?
O The world price of oil increases rapidly without warning but is not expected to remain at the new high level permanently. However, in the
short run, it is more costly for all firms to produce goods and services.
The government introduces a set of new regulations that make it more costly for firms to produce and sell goods and services. These
regulations are expected to be permanent.
O The interest rate decreases, spurring investment spending.
There is an increase in government spending.
O There is a technological improvement that allows firms to reduce their costs of production permanently.
The following graph shows the short-run aggregate supply (SRAS) curve and the long-run aggregate supply (LRAS) curve for an economy. Suppose
the world price of oil decreases rapidly without warning but is not expected to remain at the new low level permanently. However, in the short run, it is
less costly for firms to produce goods and services.
Illustrate the short-run effect of this change, before any long-run adjustments have taken place, by shifting one or both of the supply curves (
SRAS and LRAS) on the following graph. If you do not believe there will be any long-term effects, leave the LRAS in its current position.
Note: Select and drag one or both of the curves to the desired position. Curves will snap into position, so if you try to move a curve and it snaps back
to its original position, just drag it a little farther.
240
200
LRAS
SRAS
SRAS
(?)
Expert Solution
This question has been solved!
Explore an expertly crafted, step-by-step solution for a thorough understanding of key concepts.
This is a popular solution!
Trending now
This is a popular solution!
Step by step
Solved in 2 steps with 1 images

Knowledge Booster
Learn more about
Need a deep-dive on the concept behind this application? Look no further. Learn more about this topic, economics and related others by exploring similar questions and additional content below.Recommended textbooks for you


Exploring Economics
Economics
ISBN:
9781544336329
Author:
Robert L. Sexton
Publisher:
SAGE Publications, Inc


Economics (MindTap Course List)
Economics
ISBN:
9781337617383
Author:
Roger A. Arnold
Publisher:
Cengage Learning