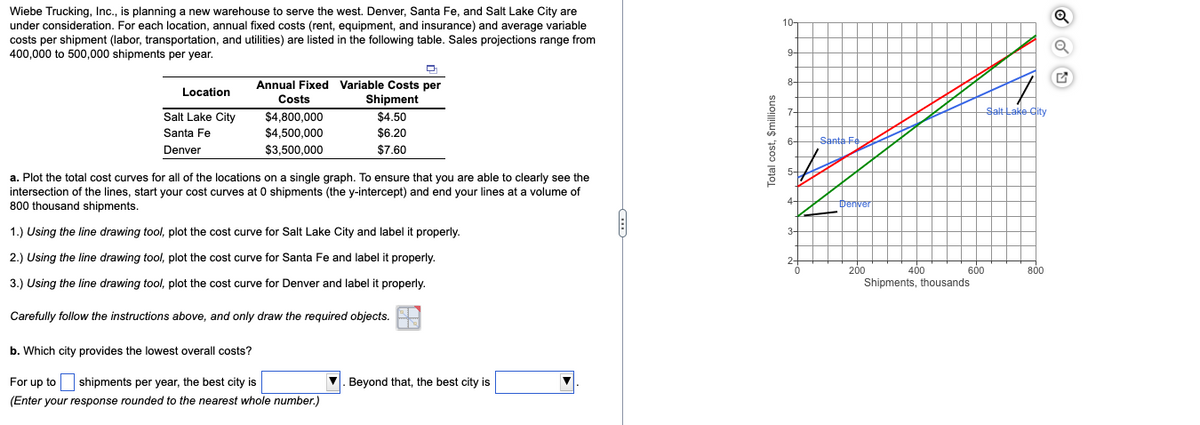
Wiebe Trucking, Inc., is planning a new warehouse to serve the west. Denver, Santa Fe, and Salt Lake City are under consideration. For each location, annual fixed costs (rent, equipment, and insurance) and average variable costs per shipment (labor, transportation, and utilities) are listed in the following table. Sales projections range from 400,000 to 500,000 shipments per year. 10- 9- Annual Fixed Variable Costs per Shipment 8- Location Costs 7- Salt Lake City Santa Fe $4,800,000 $4,500,000 $4.50 $6.20 Denver $3,500,000 $7.60 a. Plot the total cost curves for all of the locations on a single graph. To ensure that you are able to clearly see the intersection of the lines, start your cost curves at 0 shipments (the y-intercept) and end your lines at a volume of B00 thousand shipments. 1.) Using the line drawing tool, plot the cost curve for Salt Lake City and label it properly. 2.) Using the line drawing tool, plot the cost curve for Santa Fe and label it properly. 400 Shipments, thousands 200 600 800 3.) Using the line drawing tool, plot the cost curve for Denver and label it properly. Carefully follow the instructions above, and only draw the required objects. b. Which city provides the lowest overall costs? For up to shipments per year, the best city is V. Beyond that, the best city is (Enter your response rounded to the nearest whole number.) Total cost, $millions
Wiebe Trucking, Inc., is planning a new warehouse to serve the west. Denver, Santa Fe, and Salt Lake City are under consideration. For each location, annual fixed costs (rent, equipment, and insurance) and average variable costs per shipment (labor, transportation, and utilities) are listed in the following table. Sales projections range from 400,000 to 500,000 shipments per year. 10- 9- Annual Fixed Variable Costs per Shipment 8- Location Costs 7- Salt Lake City Santa Fe $4,800,000 $4,500,000 $4.50 $6.20 Denver $3,500,000 $7.60 a. Plot the total cost curves for all of the locations on a single graph. To ensure that you are able to clearly see the intersection of the lines, start your cost curves at 0 shipments (the y-intercept) and end your lines at a volume of B00 thousand shipments. 1.) Using the line drawing tool, plot the cost curve for Salt Lake City and label it properly. 2.) Using the line drawing tool, plot the cost curve for Santa Fe and label it properly. 400 Shipments, thousands 200 600 800 3.) Using the line drawing tool, plot the cost curve for Denver and label it properly. Carefully follow the instructions above, and only draw the required objects. b. Which city provides the lowest overall costs? For up to shipments per year, the best city is V. Beyond that, the best city is (Enter your response rounded to the nearest whole number.) Total cost, $millions

Managerial Economics: Applications, Strategies and Tactics (MindTap Course List)
14th Edition
ISBN:9781305506381
Author:James R. McGuigan, R. Charles Moyer, Frederick H.deB. Harris
Publisher:James R. McGuigan, R. Charles Moyer, Frederick H.deB. Harris
Chapter8: Cost Analysis
Section: Chapter Questions
Problem 5E

Related questions
Question
10
Transcribed Image Text:Wiebe Trucking, Inc., is planning a new warehouse to serve the west. Denver, Santa Fe, and Salt Lake City are
under consideration. For each location, annual fixed costs (rent, equipment, and insurance) and average variable
costs per shipment (labor, transportation, and utilities) are listed in the following table. Sales projections range from
400,000 to 500,000 shipments per year.
10-
9-
Annual Fixed Variable Costs per
8-
Location
Costs
Shipment
Salt Lake City
Salt Lake City
$4,800,000
$4,500,000
$4.50
Santa Fe
$6.20
Santa Fe
Denver
$3,500,000
$7.60
5-
a. Plot the total cost curves for all of the locations on a single graph. To ensure that you are able to clearly see the
intersection of the lines, start your cost curves at 0 shipments (the y-intercept) and end your lines at a volume of
800 thousand shipments.
Denver
1.) Using the line drawing tool, plot the cost curve for Salt Lake City and label it properly.
2.) Using the line drawing tool, plot the cost curve for Santa Fe and label it properly.
200
60
400
Shipments, thousands
800
3.) Using the line drawing tool, plot the cost curve for Denver and label it properly.
Carefully follow the instructions above, and only draw the required objects.
b. Which city provides the lowest overall costs?
For up to shipments per year, the best city is
Beyond that, the best city is
(Enter your response rounded to the nearest whole number.)
Total cost, $millions
Expert Solution
This question has been solved!
Explore an expertly crafted, step-by-step solution for a thorough understanding of key concepts.

This is a popular solution!

Trending now
This is a popular solution!

Step by step
Solved in 2 steps

Knowledge Booster


Learn more about
Need a deep-dive on the concept behind this application? Look no further. Learn more about this topic, economics and related others by exploring similar questions and additional content below.Recommended textbooks for you
Managerial Economics: Applications, Strategies an…
Economics
ISBN:
9781305506381
Author:
James R. McGuigan, R. Charles Moyer, Frederick H.deB. Harris
Publisher:
Cengage Learning

Managerial Economics: A Problem Solving Approach
Economics
ISBN:
9781337106665
Author:
Luke M. Froeb, Brian T. McCann, Michael R. Ward, Mike Shor
Publisher:
Cengage Learning

Managerial Economics: Applications, Strategies an…
Economics
ISBN:
9781305506381
Author:
James R. McGuigan, R. Charles Moyer, Frederick H.deB. Harris
Publisher:
Cengage Learning
Managerial Economics: A Problem Solving Approach
Economics
ISBN:
9781337106665
Author:
Luke M. Froeb, Brian T. McCann, Michael R. Ward, Mike Shor
Publisher:
Cengage Learning

