woda sidai sily to to 3 000 chiamos vilsinlio gaite 6. Priyam started giving fitness classes at her local community centre. She recorded the number of tidai vot know dare to bas participants each month for the first seven months in the table. Month Participants 1 480 2 576 3 691 4 829 5 995 6 1194 7 1433 a) Calculate the first and second differences, and the ratios. b) Which model appears most suitable for the data: linear, quadratic, or exponential? Justify your answer. c) Sketch a scatter plot of the data.
woda sidai sily to to 3 000 chiamos vilsinlio gaite 6. Priyam started giving fitness classes at her local community centre. She recorded the number of tidai vot know dare to bas participants each month for the first seven months in the table. Month Participants 1 480 2 576 3 691 4 829 5 995 6 1194 7 1433 a) Calculate the first and second differences, and the ratios. b) Which model appears most suitable for the data: linear, quadratic, or exponential? Justify your answer. c) Sketch a scatter plot of the data.

Elementary Geometry for College Students
6th Edition
ISBN:9781285195698
Author:Daniel C. Alexander, Geralyn M. Koeberlein
Publisher:Daniel C. Alexander, Geralyn M. Koeberlein
Chapter8: Areas Of Polygons And Circles
Section8.CR: Review Exercises
Problem 40CR

Related questions
Question
100%
Transcribed Image Text:ve tilgis not gw dato
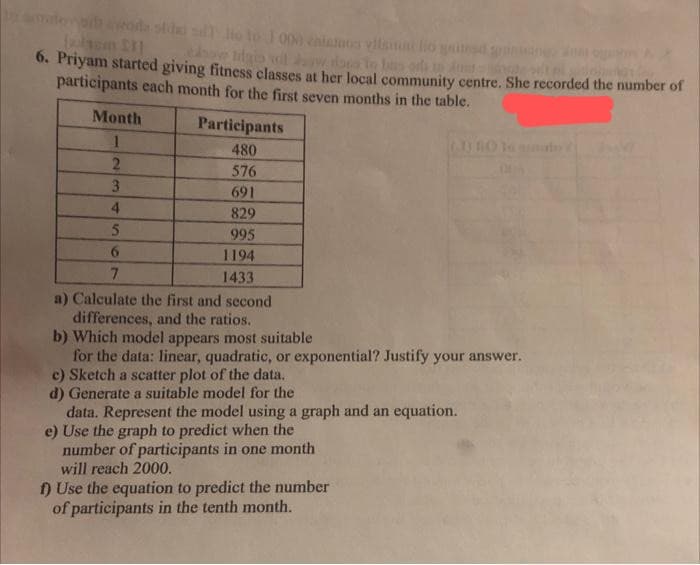
6. Priyam started giving fitness classes at her local community centre. She recorded the number of
participants each month for the first seven months in the table.
Month
Participants
1
480
2
576
3
691
4
829
5
995
6
1194
7
1433
a) Calculate the first and second
differences, and the ratios.
b) Which model appears most suitable
for the data: linear, quadratic, or exponential? Justify your answer.
c) Sketch a scatter plot of the data.
d) Generate a suitable model for the
data. Represent the model using a graph and an equation.
e) Use the graph to predict when the
number of participants in one month
will reach 2000.
f) Use the equation to predict the number
of participants in the tenth month.
Expert Solution
This question has been solved!
Explore an expertly crafted, step-by-step solution for a thorough understanding of key concepts.

Step by step
Solved in 4 steps with 1 images

Recommended textbooks for you
Elementary Geometry for College Students
Geometry
ISBN:
9781285195698
Author:
Daniel C. Alexander, Geralyn M. Koeberlein
Publisher:
Cengage Learning

Mathematics For Machine Technology
Advanced Math
ISBN:
9781337798310
Author:
Peterson, John.
Publisher:
Cengage Learning,

Elementary Geometry For College Students, 7e
Geometry
ISBN:
9781337614085
Author:
Alexander, Daniel C.; Koeberlein, Geralyn M.
Publisher:
Cengage,
Elementary Geometry for College Students
Geometry
ISBN:
9781285195698
Author:
Daniel C. Alexander, Geralyn M. Koeberlein
Publisher:
Cengage Learning
Mathematics For Machine Technology
Advanced Math
ISBN:
9781337798310
Author:
Peterson, John.
Publisher:
Cengage Learning,
Elementary Geometry For College Students, 7e
Geometry
ISBN:
9781337614085
Author:
Alexander, Daniel C.; Koeberlein, Geralyn M.
Publisher:
Cengage,

Algebra & Trigonometry with Analytic Geometry
Algebra
ISBN:
9781133382119
Author:
Swokowski
Publisher:
Cengage
