worry decrease and happiness increases, according to an analysis of 340,847 adults ages 18 to 85 in a certain country. The graphs showa portion of the research. Complete parts (a) and (b) below. * 50- E 60- 므 50- 40- 122,5) 40- 30- 20- 10- 30- 62,22) C 20- 0- 15 30 45 60 75 Age 10- 22 62 Age a. Find the slope of the line passing through the two points shown in the line graph. Express the slope as a decimal. (Round to one decimal place as needed.) b. Use the answer from part (a) to complete the statement. For each year of aging, the percentage of Americans reporting "a lot" of stress decreases by v %. The rate of change is % per Percentage Reporting Stress Percentage Reporting Stress
worry decrease and happiness increases, according to an analysis of 340,847 adults ages 18 to 85 in a certain country. The graphs showa portion of the research. Complete parts (a) and (b) below. * 50- E 60- 므 50- 40- 122,5) 40- 30- 20- 10- 30- 62,22) C 20- 0- 15 30 45 60 75 Age 10- 22 62 Age a. Find the slope of the line passing through the two points shown in the line graph. Express the slope as a decimal. (Round to one decimal place as needed.) b. Use the answer from part (a) to complete the statement. For each year of aging, the percentage of Americans reporting "a lot" of stress decreases by v %. The rate of change is % per Percentage Reporting Stress Percentage Reporting Stress

Algebra: Structure And Method, Book 1
(REV)00th Edition
ISBN:9780395977224
Author:Richard G. Brown, Mary P. Dolciani, Robert H. Sorgenfrey, William L. Cole
Publisher:Richard G. Brown, Mary P. Dolciani, Robert H. Sorgenfrey, William L. Cole
Chapter8: Introduction To Functions
Section8.6: Functions Defined By Tables And Graphs
Problem 7WE

Related questions
Question
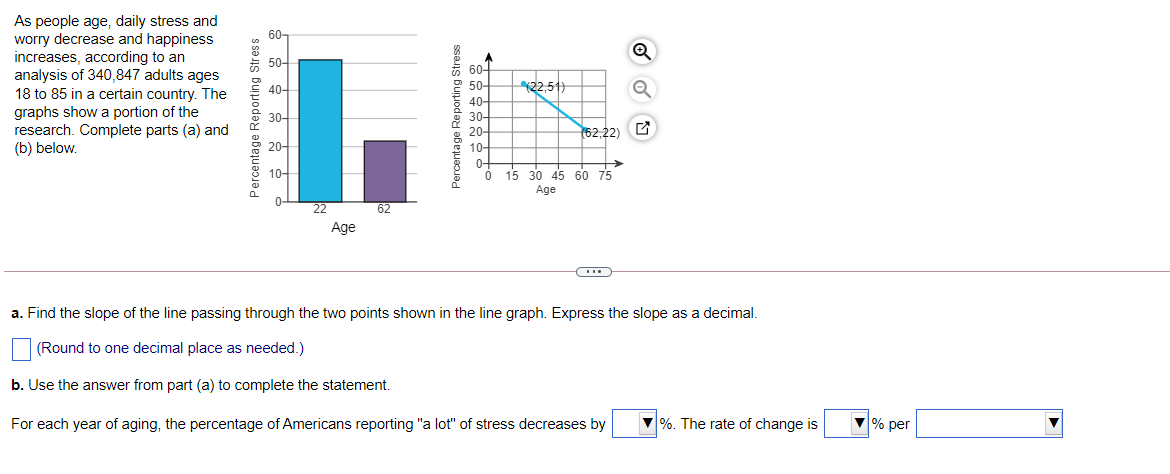
Transcribed Image Text:As people age, daily stress and
worry decrease and happiness
increases, according to an
analysis of 340,847 adults ages
60-
E 50-
60-
50-
122,51)
40-
18 to 85 in a certain country. The
40-
graphs show a portion of the
research. Complete parts (a) and
(b) below.
30-
30-
20-
(62,22) C
20-
10-
0-
15 30 45 60 75
10-
Age
22
62
Age
a. Find the slope of the line passing through the two points shown in the line graph. Express the slope as a decimal.
(Round to one decimal place as needed.)
b. Use the answer from part (a) to complete the statement.
For each year of aging, the percentage of Americans reporting "a lot" of stress decreases by
%. The rate of change is
% per
Percentage Reporting Stress
Percentage Reporting Stress
Expert Solution
Step 1
Given query is to find the slope of the Graph.

Trending now
This is a popular solution!

Step by step
Solved in 2 steps with 1 images

Recommended textbooks for you
Algebra: Structure And Method, Book 1
Algebra
ISBN:
9780395977224
Author:
Richard G. Brown, Mary P. Dolciani, Robert H. Sorgenfrey, William L. Cole
Publisher:
McDougal Littell

Algebra & Trigonometry with Analytic Geometry
Algebra
ISBN:
9781133382119
Author:
Swokowski
Publisher:
Cengage

Algebra: Structure And Method, Book 1
Algebra
ISBN:
9780395977224
Author:
Richard G. Brown, Mary P. Dolciani, Robert H. Sorgenfrey, William L. Cole
Publisher:
McDougal Littell
Algebra & Trigonometry with Analytic Geometry
Algebra
ISBN:
9781133382119
Author:
Swokowski
Publisher:
Cengage