x: 4, 4, 4, 5, 3, 3, 6, 7, 4, 4, 6, 3, 7 y: 50, 81, 62, 50, 78, 94, 72, 46, 71, 73, 62, 79, 59 Conduct a hypothesis test with a 9% level of significance to determine whether or not there is a significant linear correlation between the number of classes a student misses and their score on the final exam. Step 1: State the null and alternative hypotheses. Ho: pE Ha:p #v

Big Ideas Math A Bridge To Success Algebra 1: Student Edition 2015
1st Edition
ISBN:9781680331141
Author:HOUGHTON MIFFLIN HARCOURT
Publisher:HOUGHTON MIFFLIN HARCOURT
Chapter11: Data Analysis And Displays
Section: Chapter Questions
Problem 10CT
icon
Related questions
icon
Concept explainers
Question
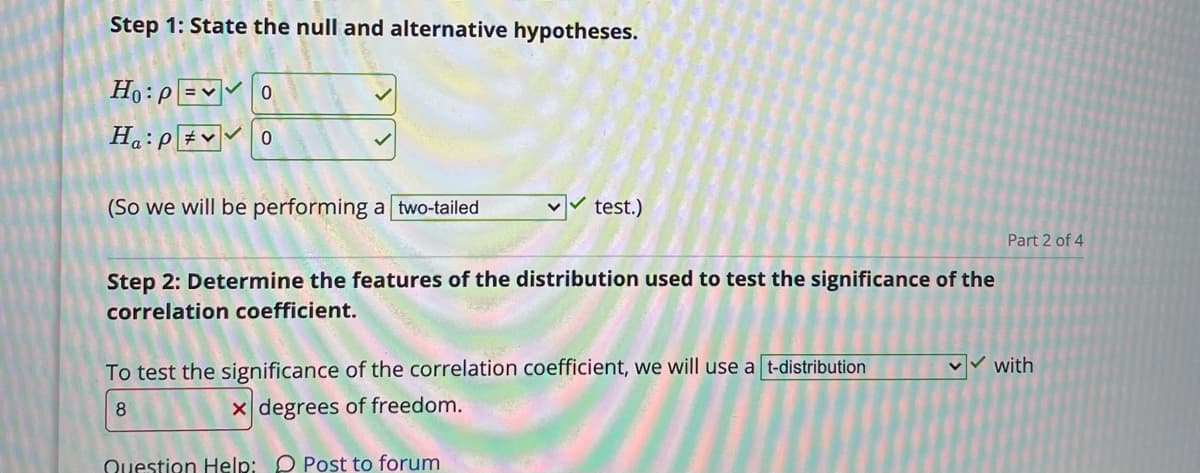
Step 1: State the null and alternative hypotheses.
Ho:p =v0
H.:P#v 0
(So we will be performing a two-tailed
test.)
Part 2 of 4
Step 2: Determine the features of the distribution used to test the significance of the
correlation coefficient.
To test the significance of the correlation coefficient, we will use a t-distribution
with
8
x degrees of freedom.
Question Help: O Post to forum
Transcribed Image Text:Step 1: State the null and alternative hypotheses. Ho:p =v0 H.:P#v 0 (So we will be performing a two-tailed test.) Part 2 of 4 Step 2: Determine the features of the distribution used to test the significance of the correlation coefficient. To test the significance of the correlation coefficient, we will use a t-distribution with 8 x degrees of freedom. Question Help: O Post to forum
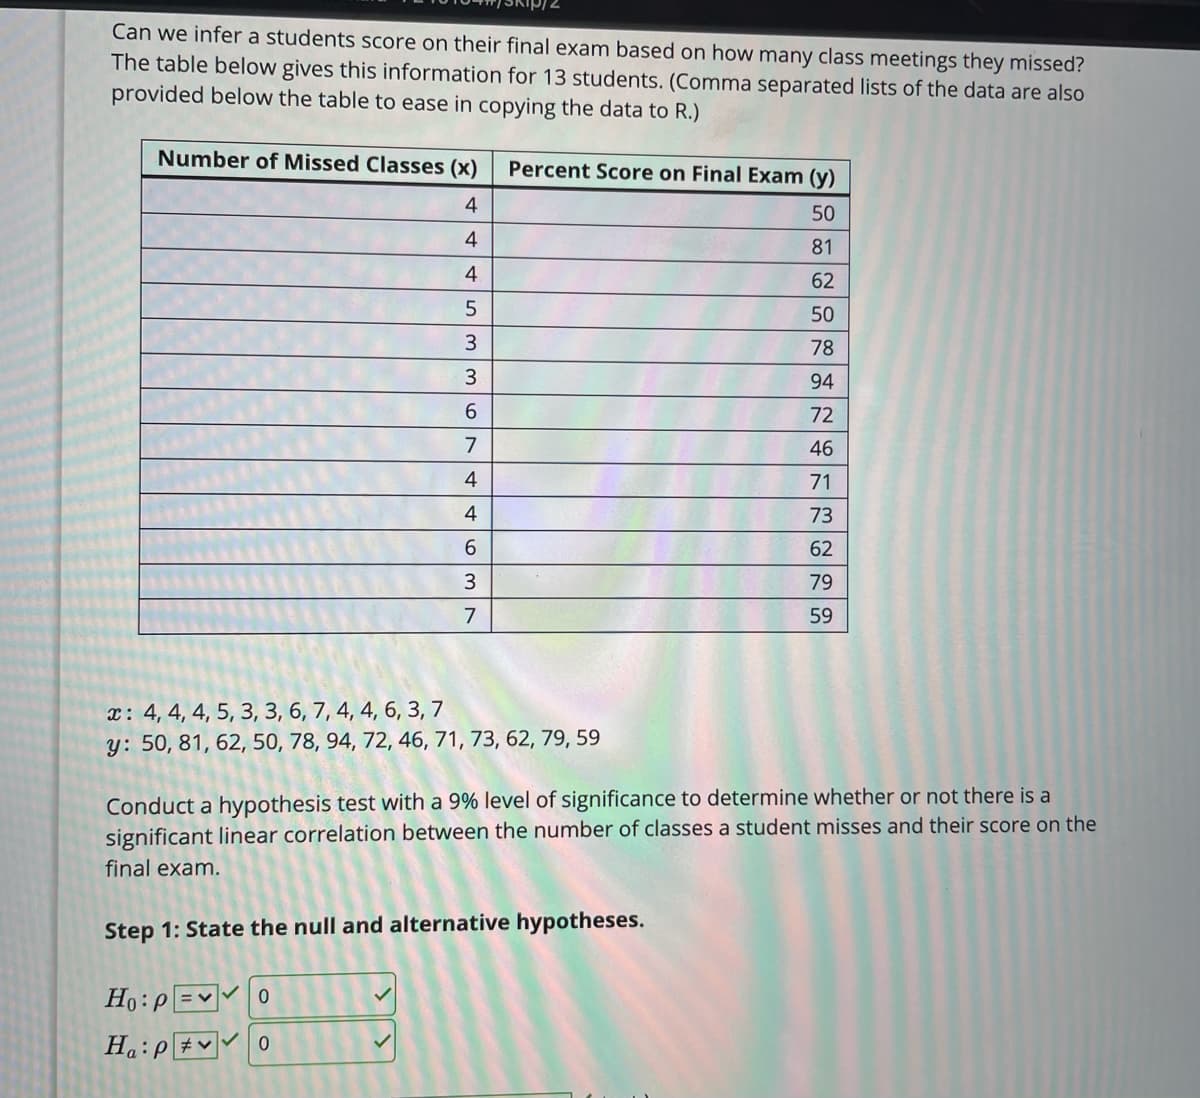
Can we infer a students score on their final exam based on how many class meetings they missed?
The table below gives this information for 13 students. (Comma separated lists of the data are also
provided below the table to ease in copying the data to R.)
Number of Missed Classes (x)
Percent Score on Final Exam (y)
50
4
81
4
62
50
3
78
3
94
6.
72
7
46
4
71
4
73
6.
62
3
79
59
x: 4, 4, 4, 5, 3, 3, 6, 7, 4, 4, 6, 3, 7
y: 50, 81, 62, 50, 78, 94, 72, 46, 71, 73, 62, 79, 59
Conduct a hypothesis test with a 9% level of significance to determine whether or not there is a
significant linear correlation between the number of classes a student misses and their score on the
final exam.
Step 1: State the null and alternative hypotheses.
Ho:p =v
Transcribed Image Text:Can we infer a students score on their final exam based on how many class meetings they missed? The table below gives this information for 13 students. (Comma separated lists of the data are also provided below the table to ease in copying the data to R.) Number of Missed Classes (x) Percent Score on Final Exam (y) 50 4 81 4 62 50 3 78 3 94 6. 72 7 46 4 71 4 73 6. 62 3 79 59 x: 4, 4, 4, 5, 3, 3, 6, 7, 4, 4, 6, 3, 7 y: 50, 81, 62, 50, 78, 94, 72, 46, 71, 73, 62, 79, 59 Conduct a hypothesis test with a 9% level of significance to determine whether or not there is a significant linear correlation between the number of classes a student misses and their score on the final exam. Step 1: State the null and alternative hypotheses. Ho:p =v
Expert Solution
steps

Step by step

Solved in 3 steps with 3 images

Blurred answer
Knowledge Booster
Correlation, Regression, and Association
Learn more about
Need a deep-dive on the concept behind this application? Look no further. Learn more about this topic, statistics and related others by exploring similar questions and additional content below.
Recommended textbooks for you
Big Ideas Math A Bridge To Success Algebra 1: Stu…
Algebra
ISBN:
9781680331141
Author:
HOUGHTON MIFFLIN HARCOURT
Publisher:
Houghton Mifflin Harcourt
Glencoe Algebra 1, Student Edition, 9780079039897…
Algebra
ISBN:
9780079039897
Author:
Carter
Publisher:
McGraw Hill