You wish to determine if there is a negative linear correlation between the two variables at a significance level of a = 0.005. You have the following bivariate data set. 25.4 8.1 16 38.1 14.5 37.9 29.7 30.2 2.7

Glencoe Algebra 1, Student Edition, 9780079039897, 0079039898, 2018
18th Edition
ISBN:9780079039897
Author:Carter
Publisher:Carter
Chapter4: Equations Of Linear Functions
Section4.5: Correlation And Causation
Problem 23PFA
icon
Related questions
icon
Concept explainers
Question
You wish to determine if there is a negative linear correlation between the two variables at a significance
level of a = 0.005. You have the following bivariate data set.
25.4
8.1
16
38.1
14.5
37.9
29.7
30.2
2.7
Hn: Select an answer V
= 0
H: Select an answer
Original claim =
OH:
O Ho
Note: In your calculations, except for the p-value and the graph, round both r and t to 3 decimal places in
ALL calculations. What is the correlation coefficient for this data set?
To find the p-value for a correlation coefficient, you need to convert to a t-score:
r2(n – 2)
t =
1- 12
This t-score is from a t-distribution with n-2 degrees of freedom.
t=
Transcribed Image Text:You wish to determine if there is a negative linear correlation between the two variables at a significance level of a = 0.005. You have the following bivariate data set. 25.4 8.1 16 38.1 14.5 37.9 29.7 30.2 2.7 Hn: Select an answer V = 0 H: Select an answer Original claim = OH: O Ho Note: In your calculations, except for the p-value and the graph, round both r and t to 3 decimal places in ALL calculations. What is the correlation coefficient for this data set? To find the p-value for a correlation coefficient, you need to convert to a t-score: r2(n – 2) t = 1- 12 This t-score is from a t-distribution with n-2 degrees of freedom. t=
What is the p-value for this correlation coefficient?
p-value =
(Round to four decimal places.)
Critical Value = t(0.005,3)=
Shade the sampling distribution curve with the correct critical value(s) and shade the critical regions. The
arrows can only be dragged to t-scores that are accurate to 1 place after the decimal point (these values
correspond to the tick marks on the horizontal axis). Select from the drop down menu to shade to the left,
to the right, between or left and right of the t-score(s).
Shade: Left of a value
v. Click and drag the arrows to adjust the values.
++
-4
-3
-2 1 -1
2
3
4
-1.5
Decision: Select an answer
Conclusion: Select an answer
the claim that there is a negative linear
correlation between the two variables.
Transcribed Image Text:What is the p-value for this correlation coefficient? p-value = (Round to four decimal places.) Critical Value = t(0.005,3)= Shade the sampling distribution curve with the correct critical value(s) and shade the critical regions. The arrows can only be dragged to t-scores that are accurate to 1 place after the decimal point (these values correspond to the tick marks on the horizontal axis). Select from the drop down menu to shade to the left, to the right, between or left and right of the t-score(s). Shade: Left of a value v. Click and drag the arrows to adjust the values. ++ -4 -3 -2 1 -1 2 3 4 -1.5 Decision: Select an answer Conclusion: Select an answer the claim that there is a negative linear correlation between the two variables.
Expert Solution
Step 1 : Hypotheses.

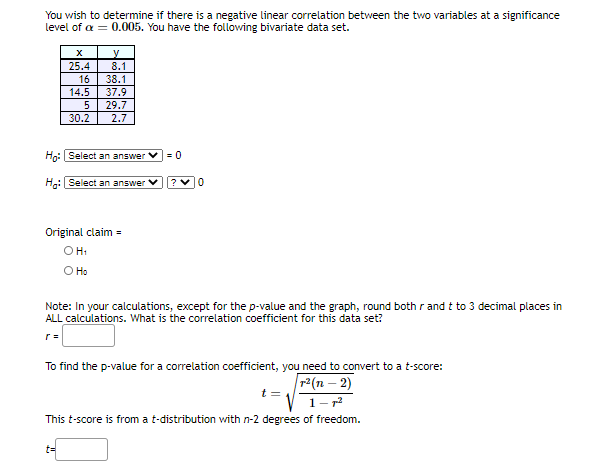
 Claim : There is a negative linear correlation between the two variables.

Based on the above claim the null and alternative being tested is ,

Null hypotheses , Ho : ρ = 0.

Alternative hypotheses , H1 : ρ < 0.

The directional of this is left tailed test .

Note : left and right tailed tests both comes under one tailed test.

Original claim : H.

Step 2 : Correlation , r.

It is asked to calculate correlation coefficient , r for the given data set.

It can be easily calculated by using MS_EXCEL.

Please refer the following steps.

  • Enter your x and y data in excel.
  • Use =CORREL ( array 1 , array2 ) function to calculate r.

it will look like , 

Statistics homework question answer, step 2, image 1

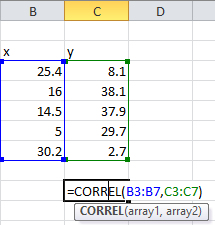
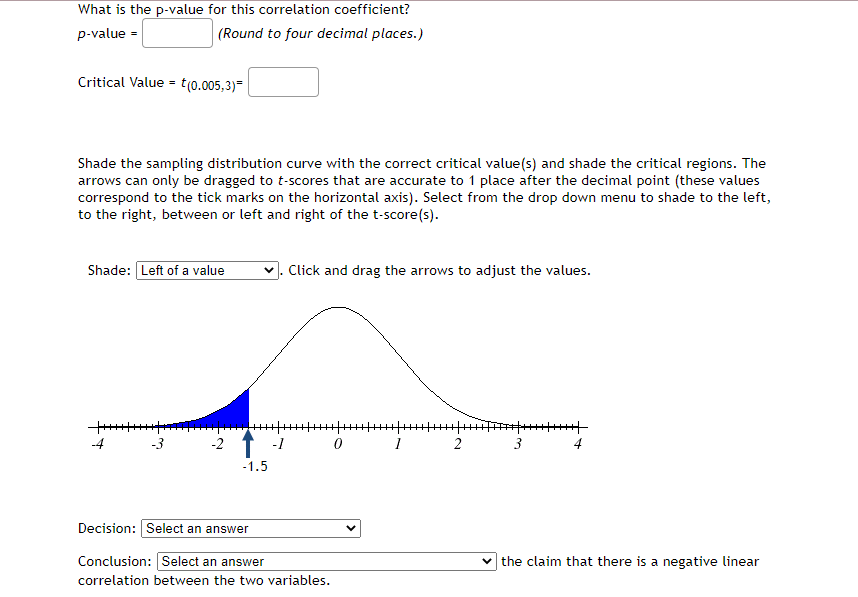
Now hit on enter to get the correlation coefficient (r) and it is equal to  -0.79684 till 3 decimal places it would be -0.797.

Thus , the correlation coefficient (r) for this data set is -0.797.


Step 3 : t score.

The formula to calculate t score is , 

t = r²(n-2)1-r²=(-0.797)²(5-2)1-(-0.797)²=2.286

Note : n is the numbers in your data set (either in x or y) so it is equal to 5.

Thus , t score = 2.286.

steps

Step by step

Solved in 6 steps with 2 images

Blurred answer
Knowledge Booster
Correlation, Regression, and Association
Learn more about
Need a deep-dive on the concept behind this application? Look no further. Learn more about this topic, statistics and related others by exploring similar questions and additional content below.
Recommended textbooks for you
Glencoe Algebra 1, Student Edition, 9780079039897…
Algebra
ISBN:
9780079039897
Author:
Carter
Publisher:
McGraw Hill