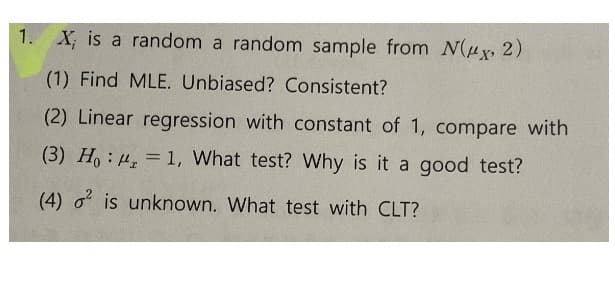
X; is a random a random sample from N(Hx 2) 1) Find MLE. Unbiased? Consistent? 2) Linear regression with constant of 1, compare with


Q: In a trivariate distribution: 01 = 3, 02 = 4, a3 = 5 r23 = 0-4, 31 = 06, n3 = 07 Determine the…
A:
Q: The quadratic regression equation shown below is for a sample of n=22. Determine the critical…
A: Given, n = 22 The regression equation is: Y^ = 4 + 3X1i + 5.5X21i To find, the critical…
Q: 2. The pdf of (X,Y) is 1 еxp TV3 fzy(x, y) ry+ 3 x<x < o, -00 < y < 0 Find the regression curve of Y…
A:
Q: Consider the following linear regression model: (i) Derive the normal equations using OLS method.…
A: Linear Regression Model:yi=β0+β1x1i+β2x2i+β3x3i+uiui =yi-β0-β1x1i-β2x2i-β3x3iTo derive the normal…
Q: In a simple linear regression of y on x, the following statistics are calculated from a sample of 10…
A: We first find the least square estimate of the slope.
Q: You are interested in the regression model: Yt = Bo + B1yt-1+B2xt + et, if yt is stationary + weakly…
A:
Q: (a) Residuals
A: The assumptions of a linear regression model 1. Linearity: There should be linear relationship…
Q: |N(0,o²), prove that the sample For the simple regression model y = ß + ɛi, where ɛ ~ can/average is…
A: Given information: Given that the simple linear regression model is yi = β + εi. The error term is…
Q: he table shows the age of a painting (x) in years, and its estimated dollar value (y). x2 y 1,200…
A:
Q: Use the multiple linear regression model. E(Y | X, X=231 + 1.25 X, +2.31 X, to answer the following…
A: Consider a regression model for the prediction of Y (dependent variable) with two predictors: X1 and…
Q: In a regression analysis involving 30 observations, the following estimated regression equation was…
A: Solution In a regression analysis involving 30 observations, the following estimated regression…
Q: Obtain the regression equation of Y on X for the following distribution. f (x, y) (1 + x)* exp (-y/1…
A: Answer: For the given data,
Q: Consider the following two simple regression models: del I Y, B,+B,X, +H, del II : Y,=a, +a,…
A: From the given information, Model I: Model II: From the model I, Consider, From the equations…
Q: Show that the following relationship on the simple linear regression class notebook is true: i=1
A: The given expression is ∑i=1nxiyi-nX¯ Y¯∑i=1nxi2-nX¯2=∑i=1nxi-X¯ yi-Y¯∑i=1nxi-X¯2, here,…
Q: From 10 observations of price (m) and supply (n) of a commodity, the following summary figures were…
A:
Q: Which assumptions of multiple regression are violated given the residual plot below Resi du als
A: Introduction: We need to identify the assumptions of multiple regression being violated, based on…
Q: Consider the regession equation: d6 gb gs(e)e where -the average diference between the monthly…
A:
Q: Based on the scatterplot above, is it appropriate to fit a simple linear regression model using X…
A: HERE GIVEN SCATTERPLOT IS IN CURVE SHAPE.
Q: 10. From a partially destroyed lab data, following results Lines of regression are: were retrieved:…
A: Solution:
Q: in the regression specification y =α+βx +δz +ε, the parameter α is called
A: In the given regression equation x and z ate the independent/ explanatory variable and y is…
Q: For ne3, Equation of Smple Linear regression TS 4= Byconsidering the given data set, Fnd Error Sr…
A: For n= 3, equation of regression, Y = 1.082 + 0.82X We have to find the error value.
Q: In a partially destroyed laboratory record, only the lines of regression of y on z and x on y are…
A: given , partially laboratory records only the lines of regression of x on y and y on x 4x-5y+33 =0…
Q: Recall our beloved linear regression model: y = XB+ € Where E(e|X) = 0 and Var(e|X) = Ito². The…
A:
Q: The researcher also ran the following simple linear regression model: Deaths = b, + b,(Income) + e,…
A: 15) To test Ho: b2=0 Vs Ha: b2≠0 (Two tailed test) Test Statistic: Under the null hypothesis,…
Q: Use multiple linear regression to fit the following tabulated data: х1 1 1 8 8. x2 6. y 14 21 11 12…
A: Given data, x1 x2 y 1 0 14 3 2 21 1 2 11 8 4 12 2 4…
Q: 23) The values of the regression coefficients are found such the sum of the residuals is…
A: We have to fill the blank of the given statement. The values of the regression coefficients are…
Q: For a simple linear regression model, a 100(1 - a)% prediction interval for a new value of Y when X…
A: PI consists range of values that is likely to contain the value of a single new observation given…
Q: We want to estimate the effect of x on y using a simple linear regression. Assume that the MLR 1-6…
A: Given Information: The effect of x on y is to be estimate using a simple linear regression. The…
Q: 4 The value and their cornesponding of Values of Shown int the table below. are 2 9) Find the least…
A: We have given that, The data set are : X :- 0, 1, 2, 3, 4 Y:- 2, 3, 5, 4, 6 Then, We will find the…
Q: Which of the following formulas describes of the Durbin-Watson test statistic and the coefficient of…
A: From given information : i.e.
Q: 8. Consider the multiple regression model to investigate the rèlationship between the number of…
A: Regression Analysis: A regression analysis is used for one of the following motives: forecasting the…
Q: Q4. State the assumption(s) under the classical linear regression model giving rise to a biased…
A: In the following i will summarize the assumptions . The first four of the following five assumptions…
Q: In a trivariate distribution: 01 = 3, 02 = 4, 03 = 5 123 = 0-4, r31 = 0-6, 13 = 0-7 %3D Determine…
A:
Q: Consider the following regression output: Ît = 0.2033 +0.656Xt se (0.0976) (0.1961) r² = 0.397…
A:
Q: Consider the linear regression model Y; = Bo + B1 X¡ + U¡ for each i = 1,... , n. Suppose we…
A: Solution Here the term Ui represent the residual for the ith observation Xi.
Q: X 06 23 3 C
A: Introductionxyx⋅yx⋅x=x206001221236431394x=100016∑y=120∑x⋅y16∑x2=30
Q: Consider the regression mode, y = a + Bx + ɛ; where, E (ɛ | x) = 0, E(ɛx) = 0, Var (ɛ|x)= oʻ, and…
A: From the given information, y=α+βx+ε Eε|x=0Eεx=0Varε|x=σ2Varα+βx|x=0 a) Vary|x=Varα+βx+ε|x…
Q: d. Test the statistical significance of each estimated regressions coefficient using a = 5% (two –…
A: d) The step by step procedure to fit the multiple regression model using Excel is given below: Enter…
Q: In working further with this problem, statisticians suggested the use of the following curvilinear…
A: (a) The regression analysis is conducted using EXCEL. The software procedure is given below: Enter…
Q: Consider the following regression output: Pt = 0.2033 + 0.656Xt se = (0.0976) (0.1961) r² = 0.397…
A: Given: The regression equation is: Yt^=0.2033+0.656Xt Where, β1=0.2033β2=0.656 n=19 Also,…
Q: (b) (c) (d) X Residuals Residuals Residuals
A:
Q: Consider estimating the relationship between annual income (income) and a dummy variable equal to 1…
A: The independent variable is gender. The dependent variable is robust. This is simple linear…
Q: The number of initial public offerings of stock issued in a 10-year period and the total proceeds of…
A: As mentioned i am solving only part b. Given data, X Y X*Y X*X Y*Y 420 17681 7426020 176400…
Q: . In a trivariate distribution. o, = 3, o, = 4, 0, = 5 r, = 0.4, r,, = 0.6 r,, = 0.7 %3D Determine…
A: The regression line has more than one independent variable then it is known as multiple linear…
Q: The following data on x maternal age in years of the young birth mothers and y= weight of baby born…
A:
Q: Let Y, be the predicted value of Y in this regression. Let 6 be the residual of a regression of Xi…
A: note : As per our company guidelines we are supposed to answer ?️only the first question. Kindly…
Q: Suppose you estimated the following regression and obtain results as outlined below. Standard errors…
A: Given the regression model as △yt=2.40.224+0.9260.043yt-1+ut
3

Step by step
Solved in 3 steps

- ) In estimating the regression in the previous problem (#2), you are concerned that the t-statistics may be inflated because of serial correlation. You compute the DW statistic at 0.724 for the regression Based on the DW, what can you say about serial correlation between the residuals? Are they positively or negatively correlated? Or not correlated? Compute the sample correlation between the regression residuals from one period and those from the previous period. Perform a statistical test at the level to see if there is serial correlation. If you are using the table in the textbook, assume that the critical values of the DW statistic for 214 observations are about 0.11 higher than the critical values for 100 observations.Consider a simple linear regression model Y=α+βX+ε. We have collected 15 samples, from which we calculated the summary statistics ∑xi=66, ∑x2i=6568, ∑yi=459, ∑y2i=27933, ∑xiyi=11311. Suppose one of the data is supposed to be (x1=10, y1=30), but is incorrectly recorded as (x1=7, y1=34). All other observations are correctly recorded. What is the OLS estimators αˆ= ? and βˆ= ? based on the correct data.Suppose that the sales of a company (Y) is regressed on advertising expenditure (x) and labor cost (z), and the estimated regression equation is Y = 5 + 0.5x + 0.7z + u (where u is the error term). Here, sales, advertising expenditure and labor cost are measured in million Tk. Standard error for the coefficient of x is 0.04, standard error for the coefficient of z is 0.01, and the sample size is 20. Can we conclude that advertising expenditure is a statistically significant variable?
- In estimating the regression in the previous problem (#2), you are concerned that the t-statistics may be inflated because of serial correlation. You compute the DW statistic at 0.724 for the regression. Compute the sample correlation between the regression residuals from one period and those from the previous period. Perform a statistical test at the level to see if there is serial correlation. If you are using the table in the textbook, assume that the critical values of the DW statistic for 214 observations are about 0.11 higher than the critical values for 100 observations.Given the residuals squared derived from the regression: Marks = ƒ(Study hours) Use the information from the following auxiliary regression (table attached) to conduct the Park test to detect for the presence of heteroscedasticity at a = 5%.A set of n = 15 pairs of X and Y values has a correlation of r = +0.80 with SSY = 75, and the regression equation for predicting Y is computed. Find the standard error of estimate for the regression equation. How big would the standard error be if the sample size were n = 30.
- The data in Table 11.17 are given for 9 patients with aplastic anemia [11]. *11.1 Fit a regression line relating the percentage of reticulocytes (x) to the number of lymphocytes (y). *11.2 Test for the statistical significance of this regression line using the F test. *11.3 What is R2 for the regression line in Problem 11.1?For the residuals derived from Sarah's regression, skewness (S) equals -0.93726 and kurtosis (K) equals 1.561158. Conduct the Jarque-Bera test of normality at α=0.01.Starting with the following null and alternative hypotheses:H0= Residuals are normally distributed.H1= Residuals are not normally distributed. part 3 Question 1 The JB test-statistic is given by ? Question 2 The χ2 statistic is given by?. Question 3 A. Since the JB statistic is greater than the χ2 statistic, H0 can be rejected. Therefore the alternative hypothesis is assumed. The residuals are not normally distributed. B. Since the JB statistic is greater than the χ2 statistic, H0 can be rejected. Therefore the null hypothesis is assumed. The residuals are normally distributed. C. Since the JB statistic is less than the χ2 statistic, H0 cannot be rejected. Therefore the null hypothesis is assumed. The residuals are normally distributed. D. Since the JB statistic is less…Jimmy tested a sample with of n=4 pairs of X and Y scores and found SSY = 48 and a Pearson correlation between X and Y of r = 0.4 Calculate whether the Fobserved in this regression experiment is significant at the ∞ = o.01 level
- Just parts d,e anf f of question 1 d) We conduct a simple regression of size on hhinc, now using robust standard errors. The regression output is reported in Table 2. Why are the estimated coefficients in Table 2 equal to the estimated coefficients in Table 1? Do the conclusions on the statistical significance at 5% of the coefficient of hhinc change between Tables 1 and 2? e) Now, using both the critical value and the p-value, test whether the coefficient of hhinc is statistically significant at 1%, by using the results in Table 1. Repeat the test by using the results in Table 2. Compare the results based on Table 1 with the results based on Table 2. Consider the results in Table 2. Compute the 99% confidence interval for hhinc. f) Consider the results in Table 2.How would you decide whether 0 is contained in the 99% confidence interval for the coefficient of hhinc, without actually computing the confidence interval?Consider a linear regression model for the decrease in blood pressure (mmHg) over a four-week period with muy=2.8+0.8x and standard deviation chi=3.2. The explanatory variable x is the number of servings fruits and vegetables in a calorie-controlled diet. Using the 68-95-99.7 rule, between what two values would approximately 95% of the observed responses, y, fall when x = 7?The following estimated regression equation based on 10 observations was presented. ŷ = 25.1270 + 0.5309x1 + 0.4920x2 Here, SST = 6,738.125, SSR = 6,221.375, sb1 = 0.0818, and sb2 = 0.0563. Perform a t test for the significance of β1. Use α = 0.05. State the null and alternative hypotheses. a. H0: β1 > 0 Ha: β1 ≤ 0 b. H0: β1 ≠ 0 Ha: β1 = 0 c. H0: β1 < 0 Ha: β1 ≥ 0 d. H0: β1 = 0 Ha: β1 > 0 e. H0: β1 = 0 Ha: β1 ≠ 0 5. Find the value of the test statistic. (Round your answer to two decimal places.) 6. Find the p-value. (Round your answer to three decimal places.) p-value = 7. State your conclusion. a. Do not reject H0. There is sufficient evidence to conclude that β1 is significant. b. Reject H0. There is insufficient evidence to conclude that β1 is significant. c. Reject H0. There is sufficient evidence to conclude that β1 is significant. d. Do not reject H0. There is insufficient evidence to conclude that…


