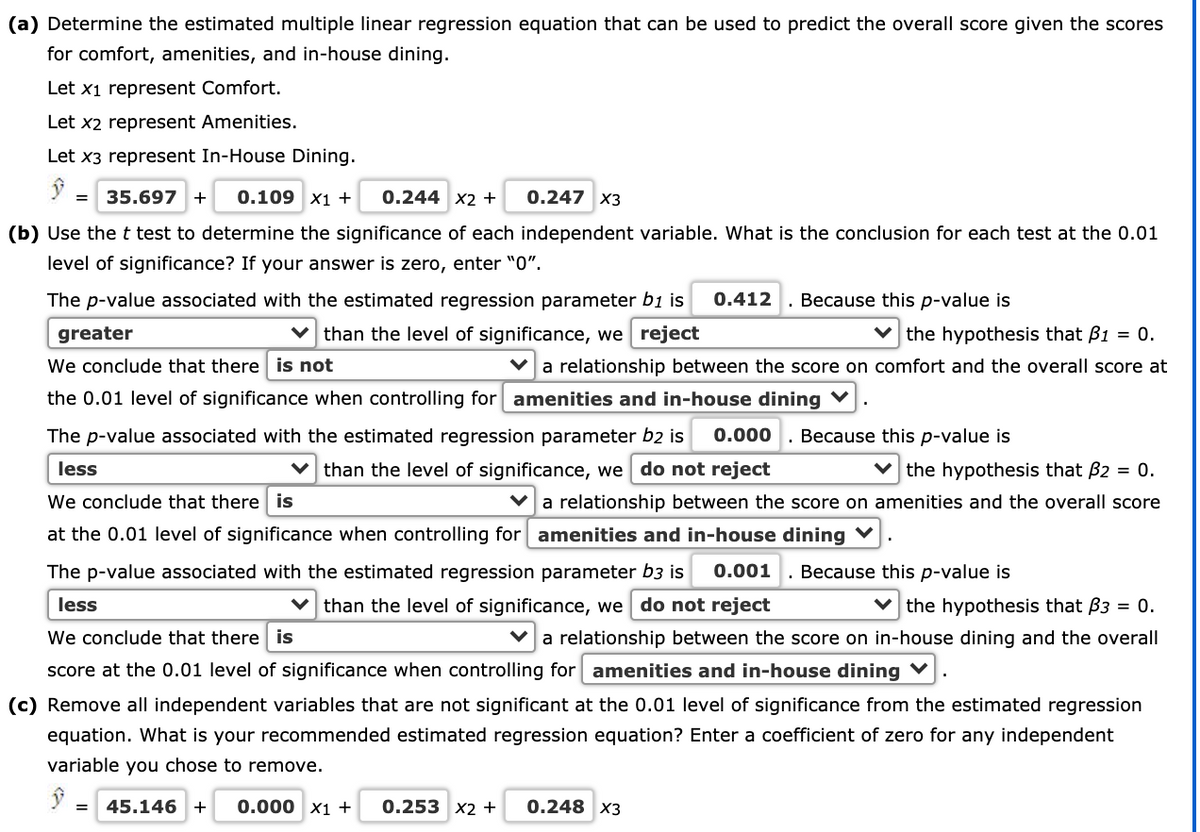
x Resorts & Spas, a magazine devoted to upscale vacations and accommodations, published its Reader's Choice List of the top 20 independent beachfront boutique hotels in the world. The data shown are the scores received by these hotels based on the results from Resorts & Spas' annual Readers' Choice Survey. Each score represents the percentage of respondents who rated a hotel as excellent or very good on one of three criteria (comfort, amenities, and in-house dining). An overall score was also reported and used to rank the hotels. The highest ranked hotel, the Muri Beach Odyssey, has an overall score of 94.3, the highest component of which is 97.7 for in-house dining. If required, round your answer to three decimal places. Click on the datafile logo to reference the data. Hotel Overall Comfort Amenities In-House Dining Muri Beach Odyssey 94.3 94.5 90.8 97.7 Pattaya Resort 92.9 96.6 84.1 96.6 Sojourner's Respite 92.8 99.9 100.0 88.4 Spa Carribe 91.2 88.5 94.7 97.0 Penang Resort and Spa 90.4 95.0 87.8 91.1 Mokihana Hōkele 90.2 92.4 82.0 98.7 Theo's of Cape Town 90.1 95.9 86.2 91.9 Cap d'Agde Resort 89.8 92.5 92.5 88.8 Spirit of Mykonos 89.3 94.6 85.8 90.7 Turismo del Mar 89.1 90.5 83.2 90.4 Hotel Iguana 89.1 90.8 81.9 88.5 Sidi Abdel Rahman Palace 89.0 93.0 93.0 89.6 Sainte-Maxime Quarters 88.6 92.5 78.2 91.2 Rotorua Inn 87.1 93.0 91.6 73.5 Club Lapu-Lapu 87.1 90.9 74.9 89.6 Terracina Retreat 86.5 94.3 78.0 91.5 Hacienda Punta Barco 86.1 95.4 77.3 90.8 Rendezvous Kolocep 86.0 94.8 76.4 91.4 Cabo de Gata Vista 86.0 92.0 72.2 89.2 Sanya Deluxe 85.1 93.4 77.3 91.8 (a) Determine the estimated multiple linear regression equation that can be used to predict the overall score given the scores for comfort, amenities, and in-house dining. Let x1 represent Comfort. Let x2 represent Amenities. Let x3 represent In-House Dining. = + x1 + x2 + x3 (b) Use the t test to determine the significance of each independent variable. What is the conclusion for each test at the 0.01 level of significance? If your answer is zero, enter “0”. The p-value associated with the estimated regression parameter b1 is . Because this p-value is - Select your answer -lessgreaterItem 6 than the level of significance, we - Select your answer -rejectdo not rejectItem 7 the hypothesis that β1 = 0. We conclude that there - Select your answer -isis notItem 8 a relationship between the score on comfort and the overall score at the 0.01 level of significance when controlling for - Select your answer -comfort and amenitiescomfort and in-house diningamenities and in-house diningItem 9 . The p-value associated with the estimated regression parameter b2 is . Because this p-value is - Select your answer -lessgreaterItem 11 than the level of significance, we - Select your answer -rejectdo not rejectItem 12 the hypothesis that β2 = 0. We conclude that there - Select your answer -isis notItem 13 a relationship between the score on amenities and the overall score at the 0.01 level of significance when controlling for - Select your answer -comfort and amenitiescomfort and in-house diningamenities and in-house diningItem 14 . The p-value associated with the estimated regression parameter b3 is . Because this p-value is - Select your answer -lessgreaterItem 16 than the level of significance, we - Select your answer -rejectdo not rejectItem 17 the hypothesis that β3 = 0. We conclude that there - Select your answer -isis notItem 18 a relationship between the score on in-house dining and the overall score at the 0.01 level of significance when controlling for - Select your answer -comfort and amenitiescomfort and in-house diningamenities and in-house diningItem 19 . (c) Remove all independent variables that are not significant at the 0.01 level of significance from the estimated regression equation. What is your recommended estimated regression equation? Enter a coefficient of zero for any independent variable you chose to remove. = + x1 + x2 + x3


Inverse Normal Distribution
The method used for finding the corresponding z-critical value in a normal distribution using the known probability is said to be an inverse normal distribution. The inverse normal distribution is a continuous probability distribution with a family of two parameters.
Mean, Median, Mode
It is a descriptive summary of a data set. It can be defined by using some of the measures. The central tendencies do not provide information regarding individual data from the dataset. However, they give a summary of the data set. The central tendency or measure of central tendency is a central or typical value for a probability distribution.
Z-Scores
A z-score is a unit of measurement used in statistics to describe the position of a raw score in terms of its distance from the mean, measured with reference to standard deviation from the mean. Z-scores are useful in statistics because they allow comparison between two scores that belong to different normal distributions.
x
|
Resorts & Spas, a magazine devoted to upscale vacations and accommodations, published its Reader's Choice List of the top 20 independent beachfront boutique hotels in the world. The data shown are the scores received by these hotels based on the results from Resorts & Spas' annual Readers' Choice Survey. Each score represents the percentage of respondents who rated a hotel as excellent or very good on one of three criteria (comfort, amenities, and in-house dining). An overall score was also reported and used to rank the hotels. The highest ranked hotel, the Muri Beach Odyssey, has an overall score of 94.3, the highest component of which is 97.7 for in-house dining. If required, round your answer to three decimal places. Click on the datafile logo to reference the data.
|


Trending now
This is a popular solution!

Step by step
Solved in 4 steps with 3 images


