X-Variable: Netflix Subscriptions 10 40 60 70 Y-Variable: Red Box Rentals 50 30 20 20 Point A B C D a. Plot points A, B, C, and D on the graph, and draw a curve that connects the points. Instruction: Use the tool provided 'Curve' to plot the 4 points to show this relationship.
X-Variable: Netflix Subscriptions 10 40 60 70 Y-Variable: Red Box Rentals 50 30 20 20 Point A B C D a. Plot points A, B, C, and D on the graph, and draw a curve that connects the points. Instruction: Use the tool provided 'Curve' to plot the 4 points to show this relationship.

Chapter1: Introducing The Economic Way Of Thinking
Section1.A: Applying Graphs To Economics
Problem 12SQ

Related questions
Question
PLease reference attachment. See image below.
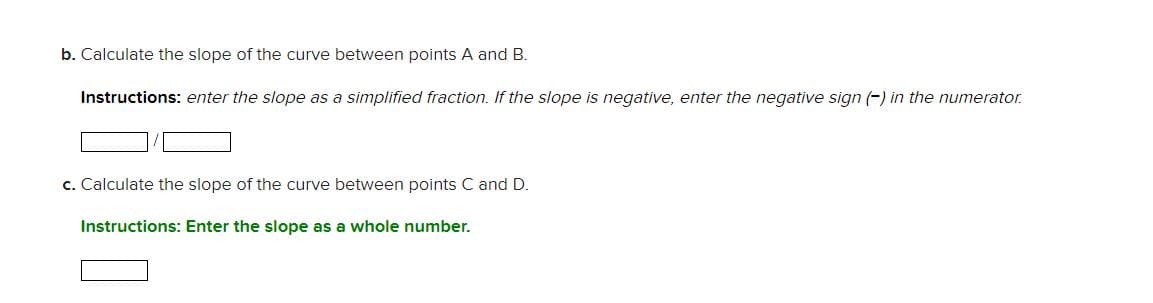
Transcribed Image Text:b. Calculate the slope of the curve between points A and B.
Instructions: enter the slope as a simplified fraction. If the slope is negative, enter the negative sign (-) in the numerator.
c. Calculate the slope of the curve between points C and D.
Instructions: Enter the slope as a whole number.
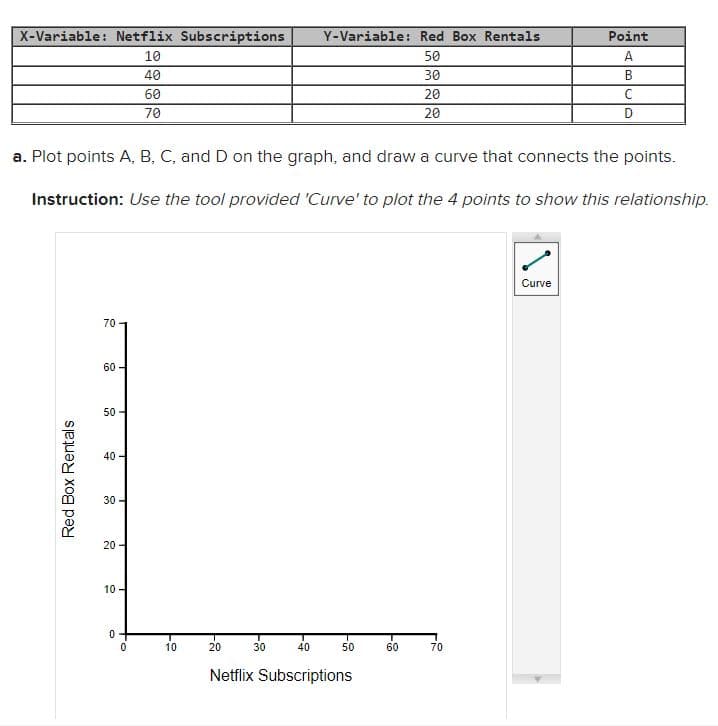
Transcribed Image Text:X-Variable: Netflix Subscriptions Y-Variable: Red Box Rentals
10
50
40
30
20
20
Red Box Rentals
a. Plot points A, B, C, and D on the graph, and draw a curve that connects the points.
Instruction: Use the tool provided 'Curve' to plot the 4 points to show this relationship.
70
60
50-
40
30
20-
10-
0
60
70
0
10
40
Netflix Subscriptions
20
30
50
60
70
Point
A
B
C
D
Curve
Expert Solution
This question has been solved!
Explore an expertly crafted, step-by-step solution for a thorough understanding of key concepts.

This is a popular solution!

Trending now
This is a popular solution!

Step by step
Solved in 2 steps with 1 images

Knowledge Booster


Learn more about
Need a deep-dive on the concept behind this application? Look no further. Learn more about this topic, economics and related others by exploring similar questions and additional content below.Recommended textbooks for you


Macroeconomics: Principles and Policy (MindTap Co…
Economics
ISBN:
9781305280601
Author:
William J. Baumol, Alan S. Blinder
Publisher:
Cengage Learning