X, Y 5000 4000 3000 2000 cm³ 1000 0 cm² or q9 fig X Ľ Y 5 10 Body Size (radius in cm) 15 Y, X Neither, because surface area and volume both increase linearly as body size increases Neither, because surface area and volume are not related to body size Cannot tell from the data provided
X, Y 5000 4000 3000 2000 cm³ 1000 0 cm² or q9 fig X Ľ Y 5 10 Body Size (radius in cm) 15 Y, X Neither, because surface area and volume both increase linearly as body size increases Neither, because surface area and volume are not related to body size Cannot tell from the data provided

Comprehensive Medical Assisting: Administrative and Clinical Competencies (MindTap Course List)
6th Edition
ISBN:9781305964792
Author:Wilburta Q. Lindh, Carol D. Tamparo, Barbara M. Dahl, Julie Morris, Cindy Correa
Publisher:Wilburta Q. Lindh, Carol D. Tamparo, Barbara M. Dahl, Julie Morris, Cindy Correa
Chapter33: Nutrition In Health And Disease
Section: Chapter Questions
Problem 10CR

Related questions
Question
please do not give solution in image format thanku
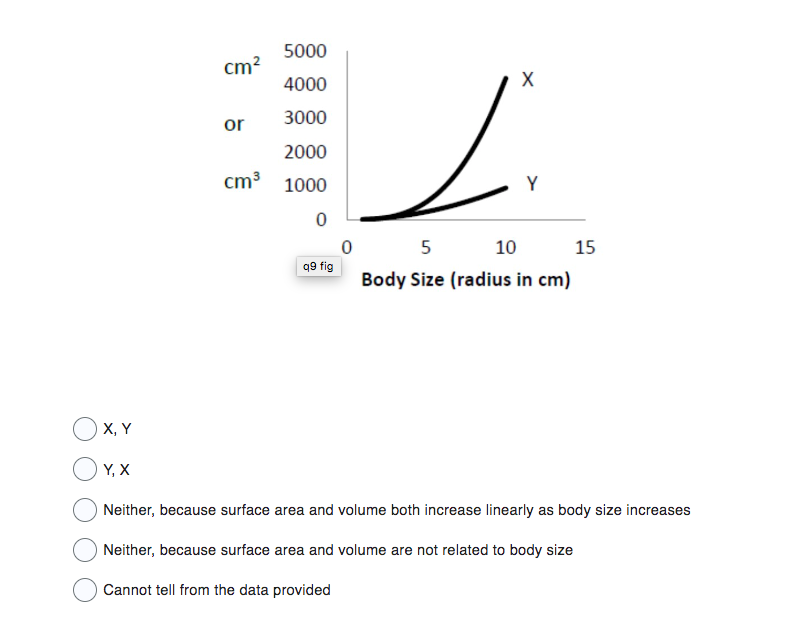
Refer to the graph below, showing surface area and volume as functions of body size.
Because of the relationships shown in the graph
Transcribed Image Text:X, Y
Y, X
cm²
or
5000
4000
3000
2000
cm³ 1000
0
q9 fig
0
X
Y
5
10
Body Size (radius in cm)
15
Neither, because surface area and volume both increase linearly as body size increases
Neither, because surface area and volume are not related to body size
Cannot tell from the data provided
Expert Solution
This question has been solved!
Explore an expertly crafted, step-by-step solution for a thorough understanding of key concepts.

Step by step
Solved in 3 steps

Recommended textbooks for you
Comprehensive Medical Assisting: Administrative a…
Nursing
ISBN:
9781305964792
Author:
Wilburta Q. Lindh, Carol D. Tamparo, Barbara M. Dahl, Julie Morris, Cindy Correa
Publisher:
Cengage Learning

Comprehensive Medical Assisting: Administrative a…
Nursing
ISBN:
9781305964792
Author:
Wilburta Q. Lindh, Carol D. Tamparo, Barbara M. Dahl, Julie Morris, Cindy Correa
Publisher:
Cengage Learning

Anatomy & Physiology
Biology
ISBN:
9781938168130
Author:
Kelly A. Young, James A. Wise, Peter DeSaix, Dean H. Kruse, Brandon Poe, Eddie Johnson, Jody E. Johnson, Oksana Korol, J. Gordon Betts, Mark Womble
Publisher:
OpenStax College