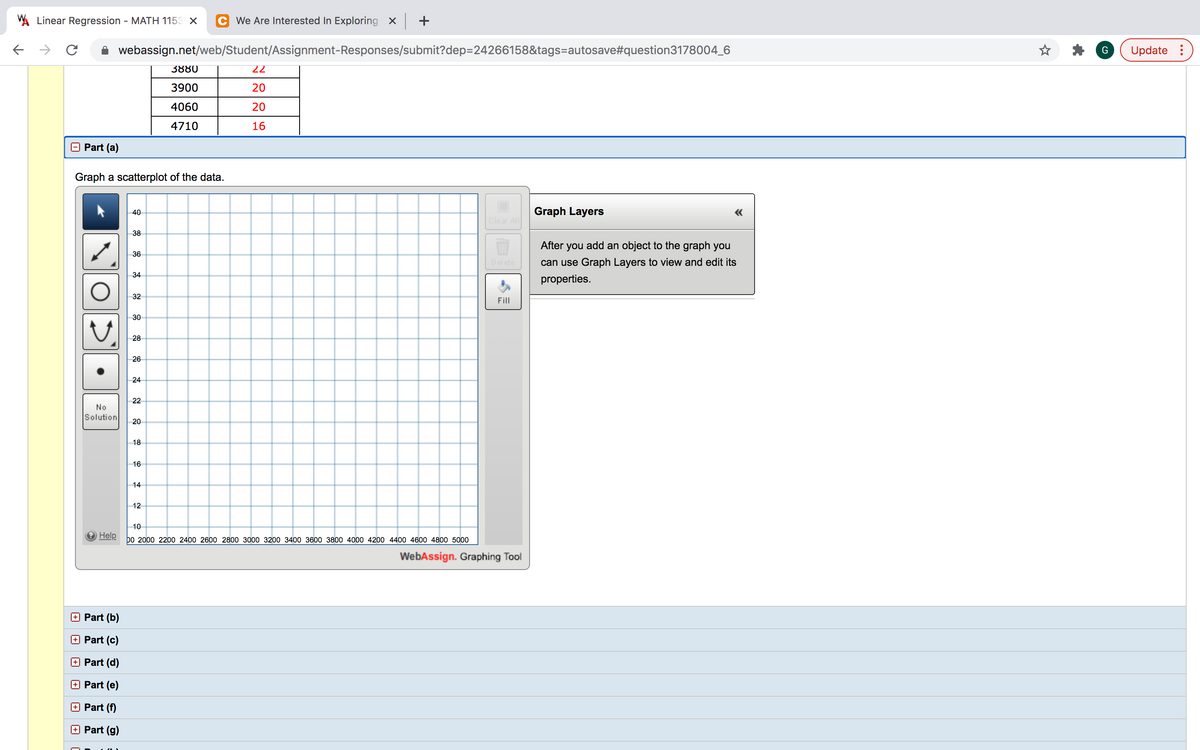
We are interested in exploring the relationship between the weight of a vehicle and its fuel efficiency (gasoline mileage). The data in the table show the weights, in pounds, and fuel efficiency, measured in miles per gallon, for a sample of 12 vehicles. Weight Fuel Efficiency 2715 26 2560 26 2630 29 2790 38 3000 24 3410 24 3640 20 3700 25 3880 22 3900 20 4060 20 4710 16 1) Graph a scatterplot of the data.


Correlation
Correlation defines a relationship between two independent variables. It tells the degree to which variables move in relation to each other. When two sets of data are related to each other, there is a correlation between them.
Linear Correlation
A correlation is used to determine the relationships between numerical and categorical variables. In other words, it is an indicator of how things are connected to one another. The correlation analysis is the study of how variables are related.
Regression Analysis
Regression analysis is a statistical method in which it estimates the relationship between a dependent variable and one or more independent variable. In simple terms dependent variable is called as outcome variable and independent variable is called as predictors. Regression analysis is one of the methods to find the trends in data. The independent variable used in Regression analysis is named Predictor variable. It offers data of an associated dependent variable regarding a particular outcome.
We are interested in exploring the relationship between the weight of a vehicle and its fuel efficiency (gasoline mileage). The data in the table show the weights, in pounds, and fuel efficiency, measured in miles per gallon, for a sample of 12 vehicles.
| Weight | Fuel Efficiency |
|---|---|
| 2715 | 26 |
| 2560 | 26 |
| 2630 | 29 |
| 2790 | 38 |
| 3000 | 24 |
| 3410 | 24 |
| 3640 | 20 |
| 3700 | 25 |
| 3880 | 22 |
| 3900 | 20 |
| 4060 | 20 |
| 4710 | 16 |
1) Graph a


Trending now
This is a popular solution!

Step by step
Solved in 2 steps with 1 images


