Year Period 1988 1989 1990 1 2 3 Budge ($ billion 3.03 3.29 3.56

MATLAB: An Introduction with Applications
6th Edition
ISBN:9781119256830
Author:Amos Gilat
Publisher:Amos Gilat
Chapter1: Starting With Matlab
Section: Chapter Questions
Problem 1P

Related questions
Question
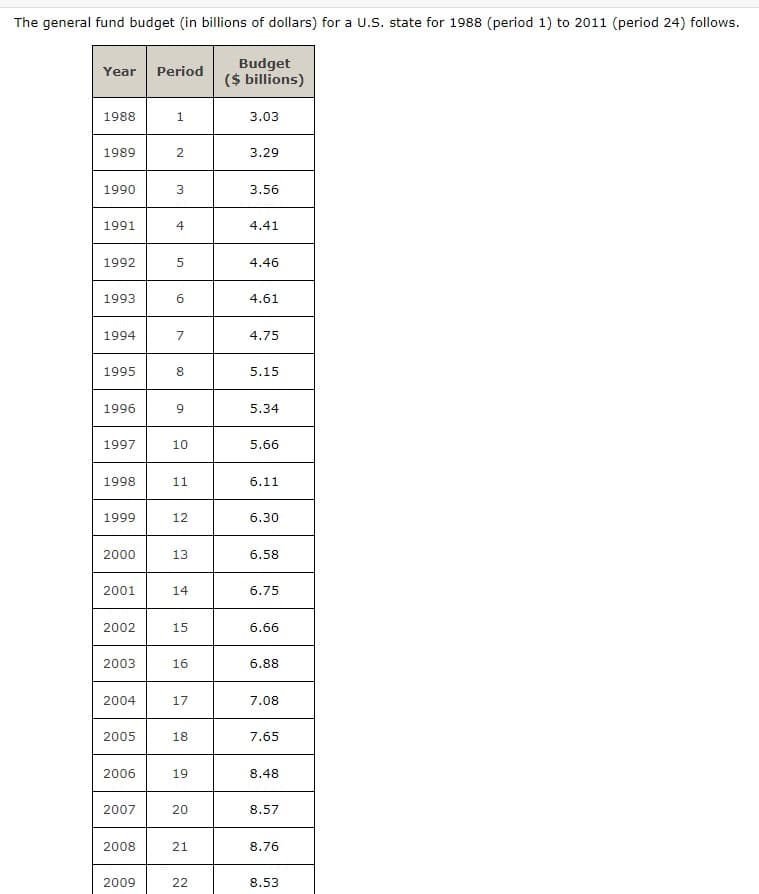
Transcribed Image Text:The general fund budget (in billions of dollars) for a U.S. state for 1988 (period 1) to 2011 (period 24) follows.
Budget
($ billions)
Year Period
1988
1989
1990
1991
1992
1993
1994
1995
1996
1997
1998
1999
2000
2001
2002
2003
2004
2005
2006
2007
2008
2009
1
2
3
4
5
6
7
8
00
9
10
11
12
13
14
15
16
17
18
19
20
21
22
3.03
3.29
3.56
4.41
4.46
4.61
4.75
5.15
5.34
5.66
6.11
6.30
6.58
6.75
6.66
6.88
7.08
7.65
8.48
8.57
8.76
8.53
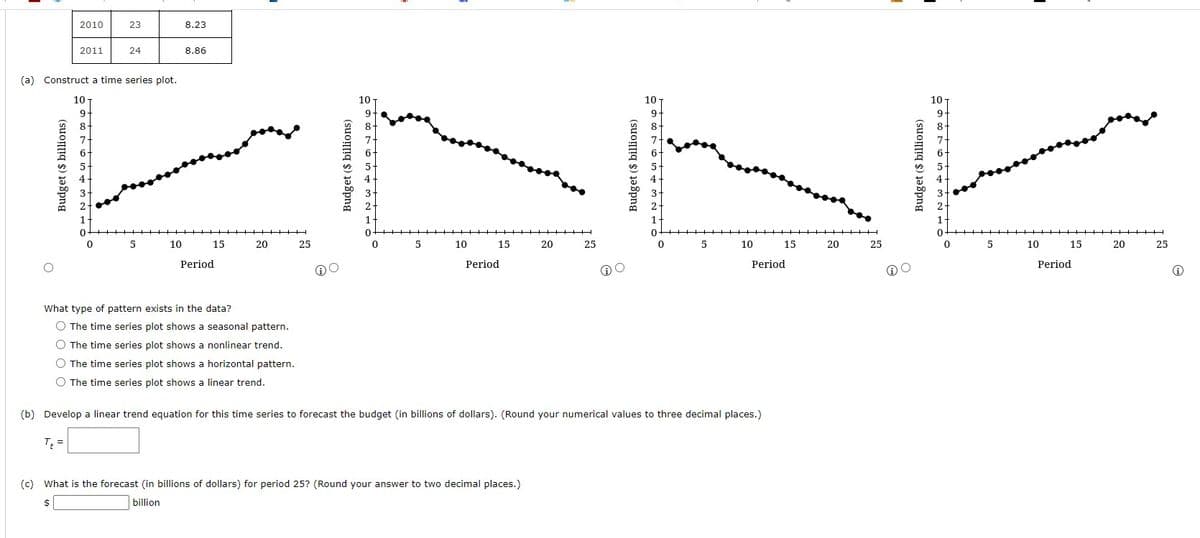
Transcribed Image Text:2010
Budget ($ billions)
2011
23
(a) Construct a time series plot.
10 T
9+
1
0
24
0 5
10
8.23
8.86
15
Period
20
HH
What type of pattern exists in the data?
O The time series plot shows a seasonal pattern.
O The time series plot shows a nonlinear trend.
O The time series plot shows a horizontal pattern.
O The time series plot shows a linear trend.
25
@O
Budget ($ billions)
10
9
2-
1
0
0 5
10
15
Period
20
(c) What is the forecast (in billions of dollars) for period 25? (Round your answer to two decimal places.)
$
billion
25
GO
Budget ($ billions)
10
9
8
1
0
0 5
10
(b) Develop a linear trend equation for this time series to forecast the budget (in billions of dollars). (Round your numerical values to three decimal places.)
Tt=
15
Period
20 25
O
Budget ($ billions)
10
9
2
1
0
0
5
10
15
Period
▬|||||
20
25
Ⓡ
Expert Solution
This question has been solved!
Explore an expertly crafted, step-by-step solution for a thorough understanding of key concepts.

Step by step
Solved in 2 steps with 1 images

Recommended textbooks for you
MATLAB: An Introduction with Applications
Statistics
ISBN:
9781119256830
Author:
Amos Gilat
Publisher:
John Wiley & Sons Inc

Probability and Statistics for Engineering and th…
Statistics
ISBN:
9781305251809
Author:
Jay L. Devore
Publisher:
Cengage Learning

Statistics for The Behavioral Sciences (MindTap C…
Statistics
ISBN:
9781305504912
Author:
Frederick J Gravetter, Larry B. Wallnau
Publisher:
Cengage Learning
MATLAB: An Introduction with Applications
Statistics
ISBN:
9781119256830
Author:
Amos Gilat
Publisher:
John Wiley & Sons Inc
Probability and Statistics for Engineering and th…
Statistics
ISBN:
9781305251809
Author:
Jay L. Devore
Publisher:
Cengage Learning
Statistics for The Behavioral Sciences (MindTap C…
Statistics
ISBN:
9781305504912
Author:
Frederick J Gravetter, Larry B. Wallnau
Publisher:
Cengage Learning

Elementary Statistics: Picturing the World (7th E…
Statistics
ISBN:
9780134683416
Author:
Ron Larson, Betsy Farber
Publisher:
PEARSON

The Basic Practice of Statistics
Statistics
ISBN:
9781319042578
Author:
David S. Moore, William I. Notz, Michael A. Fligner
Publisher:
W. H. Freeman

Introduction to the Practice of Statistics
Statistics
ISBN:
9781319013387
Author:
David S. Moore, George P. McCabe, Bruce A. Craig
Publisher:
W. H. Freeman