Year (Y) Population Size (N) 1910 30 1920 125 1930 350 1940 1200 1950 Graph the data from the table above into the answer box. Use the information from the graph to complete the following questions. Answer: 1. Considering ONLY the information you were given in the introductory paragraph regarding reindeer reproductive habits and predation, would you predict that the population growth curve would be logistic or exponential? Support your answer.
Year (Y) Population Size (N) 1910 30 1920 125 1930 350 1940 1200 1950 Graph the data from the table above into the answer box. Use the information from the graph to complete the following questions. Answer: 1. Considering ONLY the information you were given in the introductory paragraph regarding reindeer reproductive habits and predation, would you predict that the population growth curve would be logistic or exponential? Support your answer.

Biology (MindTap Course List)
11th Edition
ISBN:9781337392938
Author:Eldra Solomon, Charles Martin, Diana W. Martin, Linda R. Berg
Publisher:Eldra Solomon, Charles Martin, Diana W. Martin, Linda R. Berg
Chapter53: Introduction To Ecology: Population Ecology
Section: Chapter Questions
Problem 5TYU: In a graph of population size versus time, a J-shaped curve is characteristic of (a) exponential...

Related questions

Question
Need help with question 2, 3 and 4. Question 1 and 2 has already answer.
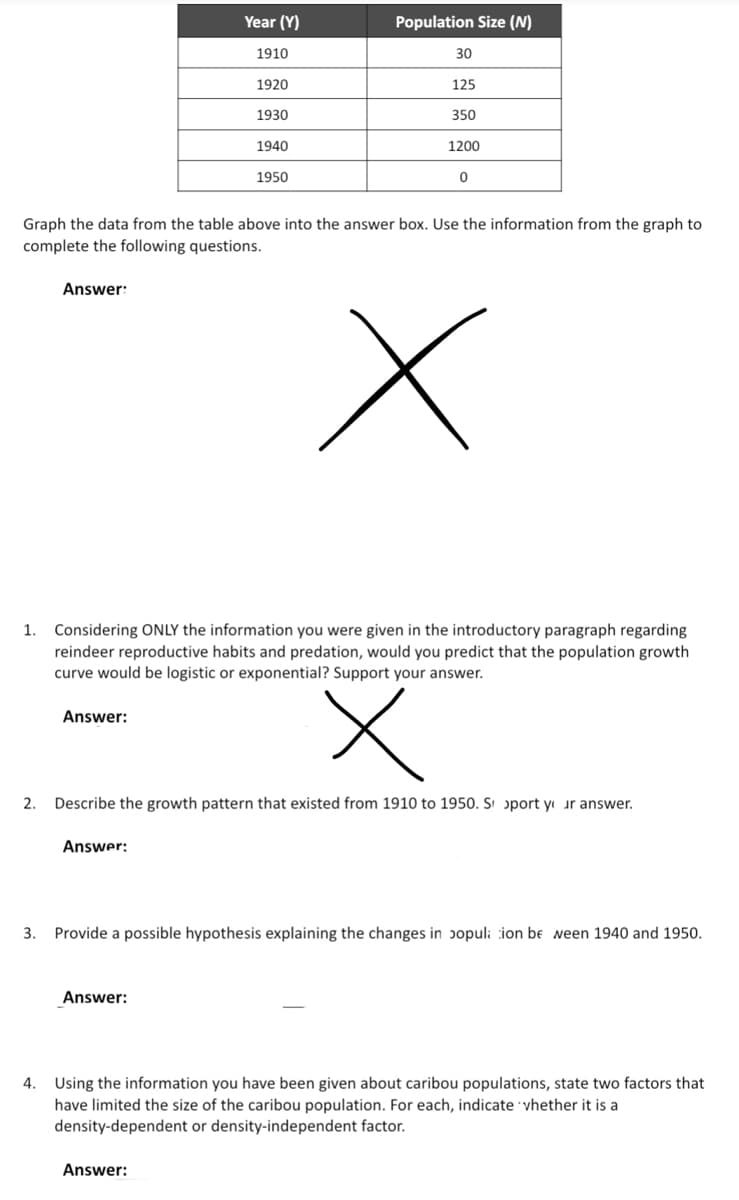
Transcribed Image Text:Year (Y)
Population Size (N)
1910
30
1920
125
1930
350
1940
1200
1950
Graph the data from the table above into the answer box. Use the information from the graph to
complete the following questions.
Answer:
1. Considering ONLY the information you were given in the introductory paragraph regarding
reindeer reproductive habits and predation, would you predict that the population growth
curve would be logistic or exponential? Support your answer.
Answer:
2.
Describe the growth pattern that existed from 1910 to 1950. Sı ɔport y ur answer.
Answer:
3.
Provide a possible hypothesis explaining the changes in ɔopuli ion be ween 1940 and 1950.
Answer:
4. Using the information you have been given about caribou populations, state two factors that
have limited the size of the caribou population. For each, indicate vhether it is a
density-dependent or density-independent factor.
Answer:
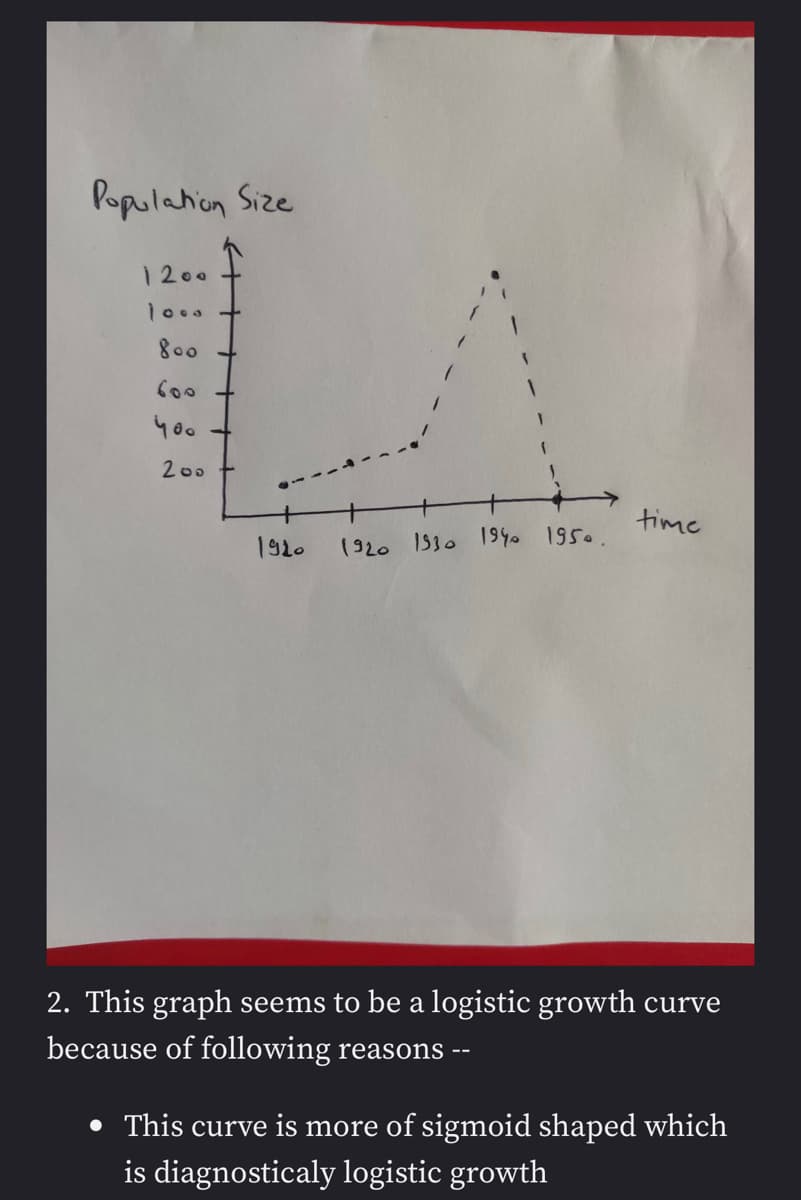
Transcribed Image Text:Populahion Size
1200
1o00
800
400
200
time
1920
(920 IS30 19% 1950.
2. This graph seems to be a logistic growth curve
because of following reasons
--
• This curve is more of sigmoid shaped which
is diagnosticaly logistic growth
Expert Solution
This question has been solved!
Explore an expertly crafted, step-by-step solution for a thorough understanding of key concepts.

This is a popular solution!

Trending now
This is a popular solution!

Step by step
Solved in 2 steps

Knowledge Booster


Learn more about
Need a deep-dive on the concept behind this application? Look no further. Learn more about this topic, biology and related others by exploring similar questions and additional content below.Recommended textbooks for you
Biology (MindTap Course List)
Biology
ISBN:
9781337392938
Author:
Eldra Solomon, Charles Martin, Diana W. Martin, Linda R. Berg
Publisher:
Cengage Learning

Case Studies In Health Information Management
Biology
ISBN:
9781337676908
Author:
SCHNERING
Publisher:
Cengage
Biology (MindTap Course List)
Biology
ISBN:
9781337392938
Author:
Eldra Solomon, Charles Martin, Diana W. Martin, Linda R. Berg
Publisher:
Cengage Learning
Case Studies In Health Information Management
Biology
ISBN:
9781337676908
Author:
SCHNERING
Publisher:
Cengage