Conduct the hypothesis test and provide the test statistic and the critical value, and state the conclusion. A company claims that its packages of 100 candies are distributed with the following color percentages: 15% red, 22% orange, 13% yellow, 10% brown, 22% blue, and 18% green. Use the given sample data to test th claimed Use a 0.10 significance level. Click the icon to view the color counts for the candy in the package. Click here to view the chi-square distribution table. CLB The test statistic is (Round to two decimal places as needed.) The critical value is (Round to three decimal places as needed.) State the conclusion. Ho There sufficient evidence to warrant rejection of the claim that the color distribution is as claimed.
Conduct the hypothesis test and provide the test statistic and the critical value, and state the conclusion. A company claims that its packages of 100 candies are distributed with the following color percentages: 15% red, 22% orange, 13% yellow, 10% brown, 22% blue, and 18% green. Use the given sample data to test th claimed Use a 0.10 significance level. Click the icon to view the color counts for the candy in the package. Click here to view the chi-square distribution table. CLB The test statistic is (Round to two decimal places as needed.) The critical value is (Round to three decimal places as needed.) State the conclusion. Ho There sufficient evidence to warrant rejection of the claim that the color distribution is as claimed.

Glencoe Algebra 1, Student Edition, 9780079039897, 0079039898, 2018
18th Edition
ISBN:9780079039897
Author:Carter
Publisher:Carter
Chapter10: Statistics
Section10.6: Summarizing Categorical Data
Problem 30PPS

Related questions
Question
Transcribed Image Text:at the c
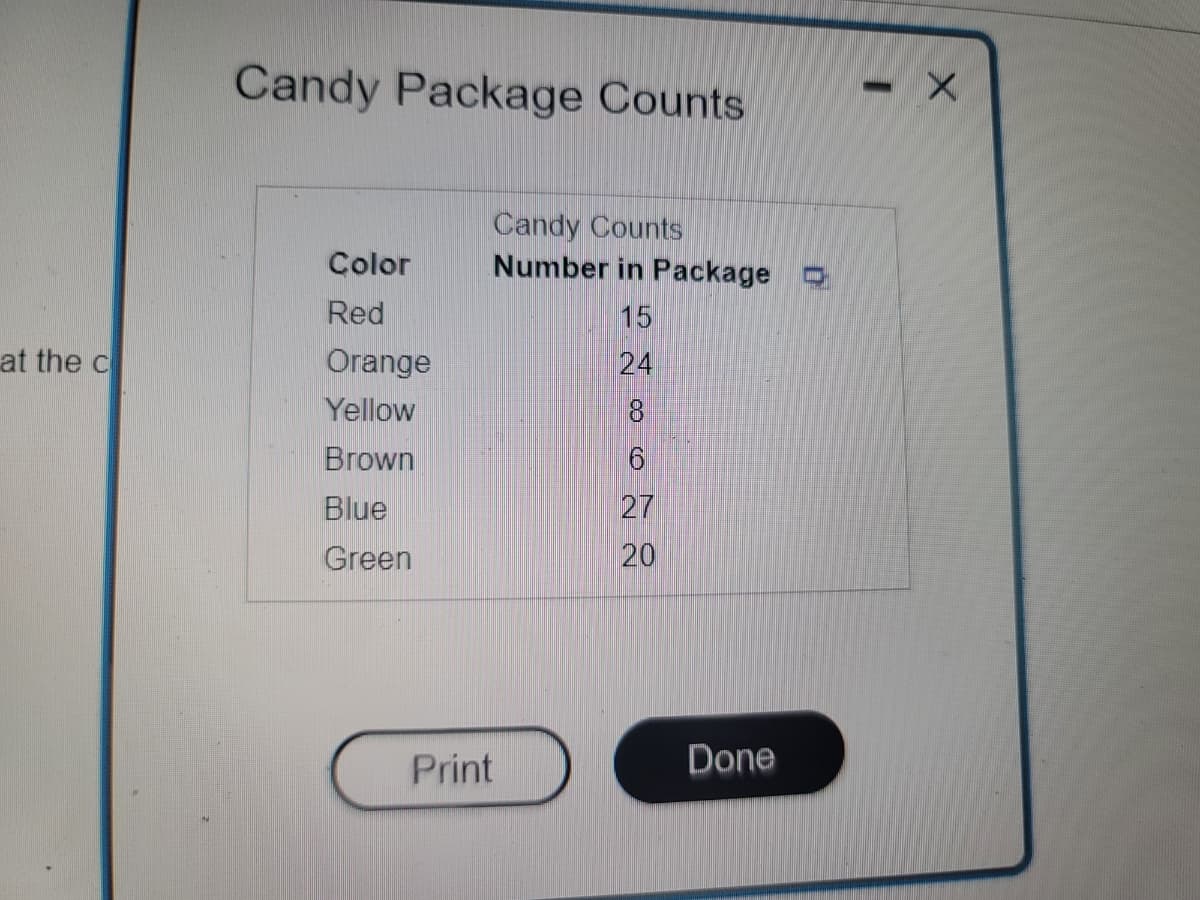
Candy Package Counts
Candy Counts
Color
Number in Package
Red
15
Orange
24
Yellow
8
Brown
6
Blue
27
Green
20
Print
Done
I
X
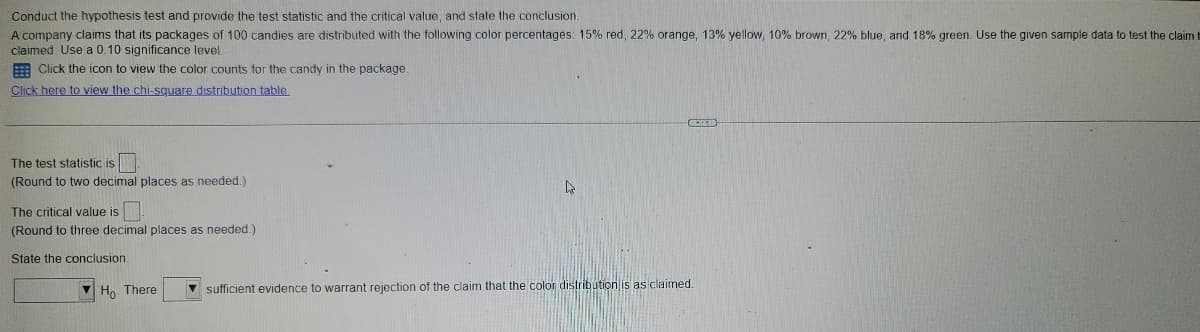
Transcribed Image Text:Conduct the hypothesis test and provide the test statistic and the critical value, and state the conclusion.
A company claims that its packages of 100 candies are distributed with the following color percentages: 15% red, 22% orange, 13% yellow, 10% brown, 22% blue, and 18% green. Use the given sample data to test the claim t
claimed Use a 0.10 significance level.
Click the icon to view the color counts for the candy in the package.
Click here to view the chi-square distribution table.
CED
The test statistic is
(Round to two decimal places as needed.)
A
The critical value is
(Round to three decimal places as needed.)
State the conclusion.
Ho There
sufficient evidence to warrant rejection of the claim that the color distribution is as claimed.
Expert Solution
This question has been solved!
Explore an expertly crafted, step-by-step solution for a thorough understanding of key concepts.

This is a popular solution!

Trending now
This is a popular solution!

Step by step
Solved in 2 steps with 3 images

Recommended textbooks for you
Glencoe Algebra 1, Student Edition, 9780079039897…
Algebra
ISBN:
9780079039897
Author:
Carter
Publisher:
McGraw Hill

College Algebra (MindTap Course List)
Algebra
ISBN:
9781305652231
Author:
R. David Gustafson, Jeff Hughes
Publisher:
Cengage Learning

Glencoe Algebra 1, Student Edition, 9780079039897…
Algebra
ISBN:
9780079039897
Author:
Carter
Publisher:
McGraw Hill
College Algebra (MindTap Course List)
Algebra
ISBN:
9781305652231
Author:
R. David Gustafson, Jeff Hughes
Publisher:
Cengage Learning