Given are five observations for two variables, x and y. 1 3 12 15 17 Yi 54 51 43 25 12 The estimated regression equation for these data is y = 58.96 – 2.29x. a. Compute SSE, SST, and SSR. SSE (to 2 decimals) SST (to 2 decimals) SSR (to 2 decimals) b. Compute the coefficient of determination r2. Comment on the goodness of fit. (to 3 decimals) The least squares line provided an - Select your answer - fit; % of the variability in y has been explained by the estimated regression equation (to 1 decimal). c. Compute the sample correlation coefficient. Enter negative value as negative number. (to 3 decimals)

MATLAB: An Introduction with Applications
6th Edition
ISBN:9781119256830
Author:Amos Gilat
Publisher:Amos Gilat
Chapter1: Starting With Matlab
Section: Chapter Questions
Problem 1P
icon
Related questions
icon
Concept explainers
Question

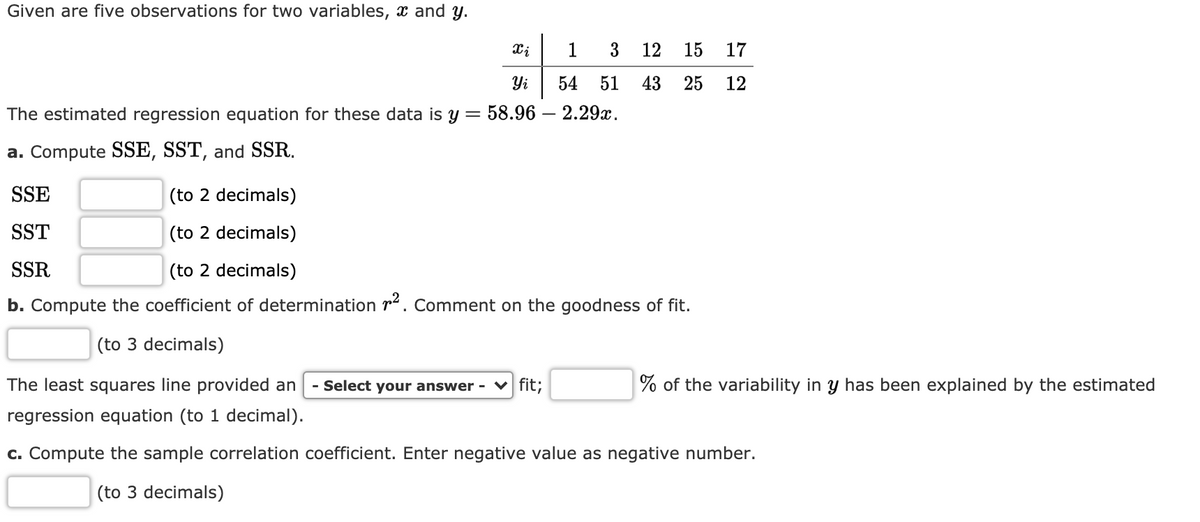
Given are five observations for two variables,  and .

xi 1 3 12 15 17
yi 54 51 43 25 12

The estimated regression equation for these data is .

Given are five observations for two variables, x and y.
1
3 12
15
17
Yi
54
51
43
25
12
The estimated regression equation for these data is y=
58.96 – 2.29x.
a. Compute SSE, SST, and SSR.
SSE
(to 2 decimals)
SST
(to 2 decimals)
SSR
(to 2 decimals)
b. Compute the coefficient of determination r. Comment on the goodness of fit.
(to 3 decimals)
The least squares line provided an
- Select your answer - V fit;
% of the variability in y has been explained by the estimated
regression equation (to 1 decimal).
c. Compute the sample correlation coefficient. Enter negative value as negative number.
(to 3 decimals)
Transcribed Image Text:Given are five observations for two variables, x and y. 1 3 12 15 17 Yi 54 51 43 25 12 The estimated regression equation for these data is y= 58.96 – 2.29x. a. Compute SSE, SST, and SSR. SSE (to 2 decimals) SST (to 2 decimals) SSR (to 2 decimals) b. Compute the coefficient of determination r. Comment on the goodness of fit. (to 3 decimals) The least squares line provided an - Select your answer - V fit; % of the variability in y has been explained by the estimated regression equation (to 1 decimal). c. Compute the sample correlation coefficient. Enter negative value as negative number. (to 3 decimals)
Expert Solution
trending now

Trending now

This is a popular solution!

steps

Step by step

Solved in 2 steps with 2 images

Blurred answer
Knowledge Booster
Correlation, Regression, and Association
Learn more about
Need a deep-dive on the concept behind this application? Look no further. Learn more about this topic, statistics and related others by exploring similar questions and additional content below.
Similar questions
  • SEE MORE QUESTIONS
Recommended textbooks for you
MATLAB: An Introduction with Applications
Statistics
ISBN:
9781119256830
Author:
Amos Gilat
Publisher:
John Wiley & Sons Inc
Probability and Statistics for Engineering and th…
Statistics
ISBN:
9781305251809
Author:
Jay L. Devore
Publisher:
Cengage Learning
Statistics for The Behavioral Sciences (MindTap C…
Statistics
ISBN:
9781305504912
Author:
Frederick J Gravetter, Larry B. Wallnau
Publisher:
Cengage Learning
Elementary Statistics: Picturing the World (7th E…
Statistics
ISBN:
9780134683416
Author:
Ron Larson, Betsy Farber
Publisher:
PEARSON
The Basic Practice of Statistics
Statistics
ISBN:
9781319042578
Author:
David S. Moore, William I. Notz, Michael A. Fligner
Publisher:
W. H. Freeman
Introduction to the Practice of Statistics
Statistics
ISBN:
9781319013387
Author:
David S. Moore, George P. McCabe, Bruce A. Craig
Publisher:
W. H. Freeman