You are considering three mutually exclusive projects with the following Projected Cash Flows Probabilities Project A Project B Project C uired $100,000 $30,000 $40,000 $50,000 $150,000 $40,000 $55,000 $67,000 $200,000 $50,000 $68,000 $70,000 1.00 0.35 ows for 5 years 0.45 0.20 a and variance of NPW distribution for each project using i ows are mutually independent. Which project has a higher probability of losing calculate probabilities for each alternative. (Hint: use normal approximation = 12%. Assume %3D
Q: The table below gives the number of seasons that each of the main six colors of Power Range appeared…
A: The bar graph is displayed in the below step.
Q: lowing table presents the highway gasoline mileage performance (y) and engine displacement (x) for…
A: The independent variable is Engine Displacement. The dependent variable is MPG. We have to do…
Q: You are on placement in a GP practice which holds a nurse-led asthma clinic once a week. The nurse…
A: Using PICO we have to construct a clinical question of whether the diet of a patient has an effect…
Q: Dayer diagnostics claims that their latest imaging equipment can identify signs of dementia with…
A: Solution Dayer diagnostics claims that their latest imaging equipment can identify signs of dementia…
Q: sión methods were used to analyze the data from a study investigating the relationship between…
A: Given the relationship between roadway surface temperature (x) and pavement deflection (y). The…
Q: The amount of coffee that people drink per day is normally distributed with a mean of 17 ounces and…
A: a. Assume a random variable X that defines the amount of coffee a randomly selected people drink per…
Q: 5. Let X be a random draw from the following box of tickets: 11 224424 6 tickets Are X and Y…
A: Given data x 0 1 1 0 1 1 y 2 2 4 4 2 4
Q: Like father, like son: In 1906, the statistician Karl Pearson measured the heights of 1078 pairs of…
A: Given: y^=50.5230+0.2781x∑x-x¯2=41.2733α=0.05 x y 69.3 71.4 66.7 68.8 70.7 71 65.7 70.9…
Q: 24, The advertised weight on a can of soup is 10 ounces. The actual weight in the cans follows a…
A: Solution
Q: The mean can be thought of as the balancing point of a distribution. According to this description,…
A: Mean A mean is the simple mathematical average of a set of two or more numbers. The mean…
Q: Test the claim that the proportion of people who own cats is significantly different than 80% at the…
A:
Q: distributed with a mean of 1,700 hours and a standard deviation of 400 hours. A random sample of 64…
A: Given that The lifetimes of a certain brand of light bulbs are known to be normally distributed…
Q: An article presented data on compressive strength x and intrinsic permeability y of various concrete…
A: Given n=14
Q: QUESTION 8 A reporter for the local news station in Angel Grove, CA wants to know how widespread…
A: In the given case, option 3 is incorrect because we can safely assume that there is no threat to…
Q: QUESTION 7 The principal of Angel Grove High School would like to determine whether or not the…
A: Given that, the principal of Angel Grove High School would like to determine whether or not the…
Q: America has become concerned with our citizen's weight. 30 student weights are recorded and the…
A:
Q: In a study about learning styles, researchers used a group of 64 elementary school students who…
A: Formula : CI=point estimate ± ME
Q: A factory produces sacks of flour, a sample of 14 pieces with the following weights are taken: Find…
A:
Q: The average amount of purchase of goods of 150 people in MAX convenience store is Php 125. The…
A: Given the average amount of purchase of goods of 150 people in MAX convenience store is PhP is 125.…
Q: (0.3507 0<x<3 The pdf of a random variable X is given as fy(x) = otherwise Find the (i) mean, (ii)…
A:
Q: One-hour carbon monoxide concentrations in air samples from a large city average 13 ppm with a…
A: Given that Mean =13 ,s.d =9
Q: Set up null and alternative hypotheses for mean area of us homes built in 2012 was 2505 square feet…
A:
Q: Suppose that vehicles taking a particular freeway exit can turn right (R), turn left (L), or go…
A: Given that, vehicles taking a particular freeway exit can turn right (R), turn left (L), or go…
Q: Fit a linear trend curve by the least-squares method to the following data and then estimate levels…
A: 1) Now estimate for the year 2023 and 2025 means x=14 ad x=16 y=8.5+3.5*14 = 57.5 tons…
Q: proportion of homes in Oregon that were heated by natural gas is different than what the DOE…
A: Given data number of success , x= 132 sample size, n =331 population proportion,p= 0.48…
Q: 9. The table below depicts hypothetical numbers of parking tickets given by police on each day of…
A: The categorical variable is day. We have to test whether the police administer parking tickets with…
Q: The chart below shows the profits earned per week by a business during the first 7 weeks after…
A: On performing data analysis,
Q: Bones Brothers & Associates prepare individual tax returns. Over prior years, Bones Brothers has…
A: Let X be the random variable from normal distribution with mean (μ) = 90, standard deviation (σ) =…
Q: The density function of a random variable is given as fx(x) = ae-bx x20. Find the characteristic…
A:
Q: According to a money report by a government institution, 18-to-20-year-old college students have an…
A:
Q: Why the probability P(X=x)=0, for a continuous variable,?
A: Given info: The probability P(X=x)=0, for a continuous variable
Q: Estimate the value of IQR for a large SRS (simple random sample) of a random variable following a…
A: IQR is based on two quartiles, first quartile and third quartile. IQR stands for interquartile…
Q: 1. A sample size of 100 grade 9 students has a mean age of ?̅= 16 ????? and the population variance…
A:
Q: Find the value of z so that the area under the standard normal curve c. between o to x is 0.4332
A:
Q: The measures how accurate the point estimate is likely to be in estimating a parameter. confidence…
A: Solution-: The ..... measurement how accurate the point estimate is likely to be estimating a…
Q: will be prepared using i= 0.5, the lowest clas 18. The true limits or the class boundaries of the…
A: 18 From the part 17, the lowest class interval is (6.4, 6.9).
Q: your null and alternative hypothesis are: H0:μ=59H0:μ=59 H1:μ≠59H1:μ≠59 Then the test is: right…
A:
Q: 10. The results of Statistics Test for 2 groups of Engineering students, 1 BTA and 2 BTA is normally…
A:
Q: Use a table of areas for the standard normal curve to find the required z-score. Find the z-score…
A:
Q: Mike Jimenez is president of the teachers' union for Preston School District. In preparing for…
A: a. As per the given information, the President of the teacher's union of Preston school district…
Q: (1) The variance of a constant is zero, i.e., if k is a constant, then var (k) = 0
A:
Q: 2. Workers in a large service industry have an average wage of $13.00 per hour with a standard…
A:
Q: A Markov chain {s}... with state space N={1, 2, 3} has a sequence of realizations and process…
A: The objective is to obtain the transition frequency matrix, followed by the transition probability…
Q: Find the median for the given sample data. A store manager kept track of the number of newspapers…
A:
Q: 8- 81 82 82 84 86 Final Exam Score 84 86 Final Exam Score (i) (ii) a) (ii) has a larger standard…
A: Solution-: We determine which distribution has the larger standard deviation of given two graphs
Q: Find the solution for the following problems a. P(Z>1.10)= b. Find z for P(Z≤z)=0.12 z= c.…
A:
Q: You are conducting a multinomial hypothesis test (αα = 0.05) for the claim that all 5 categories are…
A: According to our policy we can answered only first a three sub part for remaining please repost the…
Q: average fasting blood glucose level of 99.0 with a standard deviation of 12 (normally distributed).…
A:
Q: Please help write a research question for the bivariate relationship shown in the Tabl
A: The contingency table and the software output for the chi-square test of independence is given. The…
Q: Estimate the number of server users y (employees) when the amount of memory storage used x (GB) is x…
A: According to the question, the independent variable is amount of memory storage used (x) and the…
with calculations and reason.
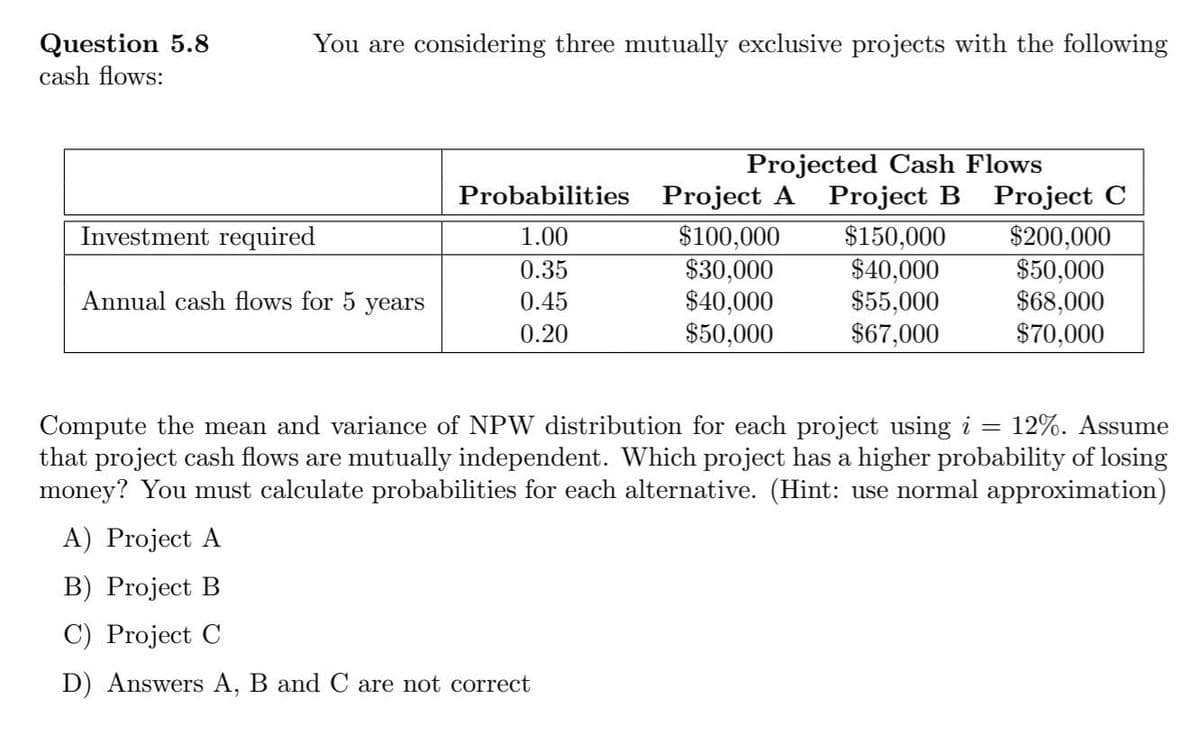
Step by step
Solved in 2 steps with 2 images
- Question 3 (Minimum-variance Hedging) A farmer has a crop of grapefruit juice that will be ready for harvest and sale as 150000 pounds of grapefruit juice in 3 months. He is worried about possible price changes, so he is considering hedging - a financial engineering technique that minimizes future uncertainties in the cash flow. Typically, hedging is carried out using futures contract. However, unfortunately, there is no futures contract for grapefruit juice, but there is a futures contract for orange juice. Still, the farmer might consider using the futures contract for orange juice as a replacement for futures contract for grapefruit juice, in the hope that these two contracts are highly correlated due to the similarity of the underlying products. Currently, the spot prices are $1.20 per pound for orange juice and $1.50 per pound for grapefruit juice. The standard deviation of the prices of orange juice and grapefruit juice is about 20% per year, and the correlation coefficient…The following table reports a portion of the annual returns (in percent) for these two funds from 2000–2016. Data for Case Study 3.2 Returns (in percent) for Janus Funds Year Balanced Overseas 2000-2.16-18.57 2001-5.04-23.11 2002-6.56-23.89 2003-13.74-36.79 2004-8.71-18.58 2005-7.75-32.39 2006-10.56-47.21 2007-10.15-27.76 2008-15.22-52.75 2009-24.28-78.12 2010-7.83-19.28 2011-1.44-32.78 2012-13.07-12.42 2013-19.72-12.1 2014-8.46-13.72 2015-0.60-8.55 2016-4.51-6.91 In a report, use the sample information to 1. Calculate measures of central location to describe the similarities and the differences in these two funds’ returns. 2. Calculate measures of dispersion to assess the risk of each fund. 3. Calculate and interpret measures of correlation between the two funds.Question 1A A CEO of a multihospital system is planning to expand operations into various states. It will take several years to get certificate of need (CON) approvals so that the new facilities can be constructed. The eventual cost (in millions of dollars) of building a facility will differ among states, depending upon finances, labor, and the economic and political climate. An outside consulting firm estimated the costs for the new facilities as based on declining, similar, or improving economies, and the associated probabilities as shown in the Table below. Decision alternatives Declining Same Improving Kentucky 22.00 19.00 15.00 Maryland 19.00 18.50 18.00 North carolina 19.50 17.00 15.50 Tennesee 23.00 17.00 14.00 Virginia 25.00 21.00 13.00 The first part should be done as cost and the second part should be done as profits. (a) Which alternative should the firm choose under the maximax criterion? (b) Which option…
- QUESTION 6 The following is a payoff table giving profits for various situations. State 1 State 2 State 3 Probability 0.4 0.35 0.25 Alternative 1 45 37 83 Alternative 2 16 59 72 Alternative 3 23 65 91 Alternative 4 44 33 55 If a person were to use the expected monetary value criterion, what decision would be made? Alternative 1 Alternative 2 Alternative 3 Alternative 4Consider the following payoff matrix.Consider the following table containing yields for mutual funds in different asset classes (small, mid, and large cap). Fund Yield by Asset Class Small Cap Mid Cap Large Cap Fund Yield (%) Fund Yield (%) Fund Yield (%) Explorer Value 2.04 Capital Value 0.96 Equity Income 3.24 Small-Cap Value Index Admiral 2.46 Mid-Cap Value Index Admiral 1.57 High Dividend Yield Index 3.50 Small-Cap Index Admiral Shares 1.49 Extended Market Index Admiral Shares 1.22 500 Index Admiral Shares 1.57 Strategic Small-Cap Equity 0.38 Mid-Cap Index Admiral Shares 1.52 Diversified Equity 1.23 Explorer 0.17 Mid-Cap Growth 2.76 FTSE Social Index 1.42 Small-Cap Growth Index Admiral 0.21 Capital Value 0.32 Growth Equity 2.52 Explorer Value 2.55 Strategic Equity 1.54 U.S. Growth 0.37 Small-Cap ETF 1.44 Capital Opportunity Admiral Shares 2.14 Windsor 1.64 sum of squares for treatmentssum of squares for error≈1.5986≈18.4205 Step 2 of 2 : Find the mean square for treatments. Round…
- Subject: Stochastic process Question 1 is attached to the image section below] Consider the following table containing yields for mutual funds in different asset classes (small, mid, and large cap). Fund Yield by Asset Class Small Cap Mid Cap Large Cap Fund Yield (%) Fund Yield (%) Fund Yield (%) Explorer Value 1.22 Capital Value 0.96 Equity Income 3.24 Small-Cap Value Index Admiral 2.46 Mid-Cap Value Index Admiral 0.52 High Dividend Yield Index 3.50 Small-Cap Index Admiral Shares 1.49 Extended Market Index Admiral Shares 1.22 500 Index Admiral Shares 0.52 Strategic Small-Cap Equity 2.61 Mid-Cap Index Admiral Shares 1.52 Diversified Equity 1.23 Explorer 0.17 Mid-Cap Growth 0.82 FTSE Social Index 1.42 Small-Cap Growth Index Admiral 0.21 Capital Value 0.32 Growth Equity 1.42 Explorer Value 1.32 Strategic Equity 1.54 U.S. Growth 0.37 Small-Cap ETF 1.44 Capital Opportunity Admiral Shares 1.27 Windsor 1.64 sum of squares for treatmentssum of squares for error≈1.7894≈15.7229 Step 1 of 2 : What are the degrees of freedom…QUESTION 3 A researcher wants to understand how an annual mortgage payment (in Ringgit) depends on income level and zonal location allowing for an interaction. The data are shown below. LOW MEDIUM HIGH KOTA KINABALU 75 165 180 120 180 195 66 15 189 90 300 180 SANDAKAN 210 225 300 255 150 345 222 162 324 300 135 480 TAWAU 225 225 225 165 210 180 123 165 237 120 210 195 LAHAD DATU 15 120 177 30 75 90 30 120 135 45 105 120 KENINGAU 5 40 59 10 25 30 10 40 45 15 35 40 a. Construct a two-way (with interaction) ANOVA table for these data. b. At the 5% significance level, can you conclude there is interaction between income and zonal location?
- Question 4 A country club wants to exam the effects of a new marketing campaign that attempts to get more people within the community to become members. In many communities, when people buy a house in the area, they receive a “Welcome Wagon” gift basket containing coupons to local restaurants. The idea of the marketing campaign is to include a free two month membership to the country club in the gift basket with the hope that once “new” residents try the country club then at least a certain proportion will want to become real members. One member of the Club’s Executive Council believes that at least 25% of the people who receive the coupons for the free membership will use the coupon. When testing the hypothesis that at least 25% of the people who receive the coupons for the free membership will use the coupon, what is the null and alternative hypothesis?Question 3 The Bank of Canada is interested in studying the relationship between mortgage rates and median home prices. The data is provided below Year Interst rate Median home price 1988 10.30 183,800 1989 10.30 183,200 1990 10.10 174,900 1991 9.30 173,500 1992 8.40 172,900 1993 7.30 173,200 1994 8.40 173,200 1995 7.90 169,700 1996 7.60 174,500 1997 7.60 177,900 1998 6.90 188,100 1999 7.40 203,200 2000 8.10 230,200 2001 7.00 258,200 2002 6.50 309,800 2003 5.80 329,800 2004 5.80 431,000 2005 5.80 515,000 2006 6.40 537,000 2007 6.30 496,000 2008 6.00 352,000 2009 5.00 232,000 2010 4.70 291,700 2011 4.40 262,900 2012 3.60 299,200 2013 4.00 321,200 2014 4.10 373,500 2015 3.80 358,100 2016 3.60 382,500 2017 4.00 402,900 a) Estimate a…QUESTION 5 A country club wants to exam the effects of a new marketing campaign that attempts to get more people within the community to become members. In many communities, when people buy a house in the area, they receive a “Welcome Wagon” gift basket containing coupons to local restaurants. The idea of the marketing campaign is to include a free two month membership to the country club in the gift basket with the hope that once “new” residents try the country club then at least a certain proportion will want to become real members. One member of the Club’s Executive Council believes that at least 80% of the people who receive the coupons for the free membership will use the coupon. In a sample of 197 new residents who received the coupon for the two month free membership, there were 136 people who actually took advantage of the free two month membership. When testing the hypothesis that at least 80% of the people that receive the coupon actually use it, what is the test statistic?…